Analysis Of Caffeine Content From Coffee Beans: Hplc/uv-vis Comparison 5ou3e
This document was ed by and they confirmed that they have the permission to share it. If you are author or own the copyright of this book, please report to us by using this report form. Report 3b7i
Overview 3e4r5l
& View Analysis Of Caffeine Content From Coffee Beans: Hplc/uv-vis Comparison as PDF for free.
More details w3441
- Words: 1,846
- Pages: 6
Concordia College Journal of Analytical Chemistry 5 (2015), 22-27
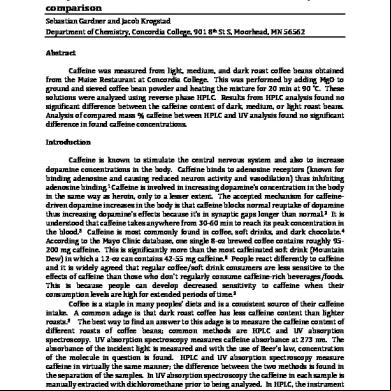
Analysis of caffeine content from coffee beans: HPLC/UV-Vis comparison Sebastian Gardner and Jacob Krogstad Department of Chemistry, Concordia College, 901 8th St S, Moorhead, MN 56562 Abstract
Caffeine was measured from light, medium, and dark roast coffee beans obtained from the Maize Restaurant at Concordia College. This was performed by adding MgO to ground and sieved coffee bean powder and heating the mixture for 20 min at 90 °C. These solutions were analyzed using reverse phase HPLC. Results from HPLC analysis found no significant difference between the caffeine content of dark, medium, or light roast beans. Analysis of compared mass % caffeine between HPLC and UV analysis found no significant difference in found caffeine concentrations. Introduction
Caffeine is known to stimulate the central nervous system and also to increase dopamine concentrations in the body. Caffeine binds to adenosine receptors (known for binding adenosine and causing reduced neuron activity and vasodilation) thus inhibiting adenosine binding.1 Caffeine is involved in increasing dopamine’s concentration in the body in the same way as heroin, only to a lesser extent. The accepted mechanism for caffeinedriven dopamine increases in the body is that caffeine blocks normal reuptake of dopamine thus increasing dopamine’s effects because it’s in synaptic gaps longer than normal.2 It is understood that caffeine takes anywhere from 30-60 min to reach its peak concentration in the blood.3 Caffeine is most commonly found in coffee, soft drinks, and dark chocolate.4 According to the Mayo Clinic database, one single 8-oz brewed coffee contains roughly 95200 mg caffeine. This is significantly more than the most caffeinated soft drink (Mountain Dew) in which a 12-oz can contains 42-55 mg caffeine.5 People react differently to caffeine and it is widely agreed that regular coffee/soft drink consumers are less sensitive to the effects of caffeine than those who don’t regularly consume caffeine-rich beverages/foods. This is because people can develop decreased sensitivity to caffeine when their consumption levels are high for extended periods of time.2 Coffee is a staple in many peoples’ diets and is a consistent source of their caffeine intake. A common adage is that dark roast coffee has less caffeine content than lighter roasts.3 The best way to find an answer to this adage is to measure the caffeine content of different roasts of coffee beans; common methods are HPLC and UV absorption spectroscopy. UV absorption spectroscopy measures caffeine absorbance at 273 nm. The absorbance of the incident light is measured and with the use of Beer’s law, concentration of the molecule in question is found. HPLC and UV absorption spectroscopy measure caffeine in virtually the same manner; the difference between the two methods is found in the separation of the samples. In UV absorption spectroscopy the caffeine in each sample is manually extracted with dichloromethane prior to being analyzed. In HPLC, the instrument separates the caffeine from the sample using column chromatography and then measures 22
Concordia College Journal of Analytical Chemistry 5 (2015), 22-27 the caffeine content. In an effort to find discrepancies with results between the coffee bean roasts as well as the two analysis processes, coffee beans from the same source were analyzed using both processes and then the results were compared. Experimental
Coffee Sample Acquisition Light, medium, and dark roast coffee beans were acquired from the Maize Restaurant at Concordia College and stored at approximately –18 °C.
Standard Preparation Approximately 20 mg caffeine (acquired from Fisher Scientific) was dissolved in ~90 mL DI water in a beaker. The solution was then stirred for 1 h. After stirring, five standards were created with concentrations of approximately 0.9 ppm, 2.3 ppm, 4.6 ppm, 6.9 ppm, and 11.5 ppm.
Sample Preparation The procedure was adapted from research performed by E. Naegele.6 Coffee beans were ground into a fine powder using a mortar and pestle and the powder was filtered through a 250-micron sieve into a weighing dish. This process was repeated for the medium and then dark roast beans. Approximately 500 mg light roast sieved powder was weighed and placed in a 400-mL beaker. Approximately 5 g MgO (J.T. Baker) was weighed and added to the light roast beaker. This process was repeated for the medium and dark roast beans. Approximately 200 mL DI water was added to each beaker and the beakers were placed on stir/hot plates. A magnetic stirring rod and thermometer were placed in each beaker and they were heated at 90 °C for 20 min. The samples were then removed from the hot plate and allowed to cool to room temperature. Each sample was then filtered into a new clean 250-mL beaker using 0.45-µm nylon syringe filters, and 10 mL of each filtered sample was transferred into a 100-mL volumetric flask and diluted with DI water. These were then ready for HPLC analysis. This entire process was repeated for each sample. HPLC Instrument A Varian ProStar HPLC equipped with a Phenomenex Kinetex XB-C18 column (2.6 μm, 100 Å, 50 × 4.6 mm) was used to measure the caffeine content of the coffee samples. The previously prepared caffeine samples along with the five caffeine standard samples were injected into the HPLC. The mobile phase used for analysis of all samples was 75% 0.025M phosphate buffer at a pH of 3.0 and 25% methanol. The column temperature was 35°C. The injection volume was 10 μL, and absorbance was measured at 272 nm. Using the Galaxy software, the peak areas of caffeine were recorded and used for analysis. Results and discussion
Caffeine standards were prepared and run through the HPLC. The HPLC produced chromatograms of the standards as seen below in Figure 1 (left). The caffeine peak had a 23
Concordia College Journal of Analytical Chemistry 5 (2015), 22-27 retention time of approximately 1.9 min. This produced a capacity factor of 1.92. The peak area of each chromatogram was plotted against the concentrations (in ppm) of each standard to produce the calibration curve seen below in Figure 1 (right).
Figure 1. Standard Chromatograms (left) and resulting calibration curve (right)
All three sample sets were run through the HPLC and the resulting chromatograms are seen below in Figure 2. Sample set 1 (top left), sample set 2 (top right), and sample set 3 (bottom) yielded similar results, regardless of coffee bean roast. The mass % of caffeine in each roast for the HPLC data was tabulated along with the average mass % and standard deviation in Table 1. The mass % of caffeine in the coffee beans for the HPLC data and the UV data was compared using F-tests and T-tests. It’s important to understand that the methods were compared using only like roasts. For example, light roast HPLC mass % caffeine results were compared to light roast UV mass % caffeine data, medium with medium, and dark with dark. The F-tests were used to determine whether or not variances between the methods were equal. The results for the F-test and T-tests between methods are shown below in Table 2. As can be seen, the F-test showed Fcalc < Ftable in all cases, therefore it was determined that the variances between methods were equal. The T-tests resulted in Tcalc < Ttable in all cases, therefore it was determined that the differences in results for caffeine content between methods were statistically insignificant. After analyzing results between the two methods, the results between the different coffee roasts were compared for the HPLC data using F-tests and T-tests and the results are seen in Table 3. F-tests were used to compare variances between the different roasts, and all roasts were determined to have equal variances because Fcalc < Ftable in all cases. Resulting T-tests then determined that all differences in caffeine content between roasts was statistically insignificant because Tcalc < Ttable in all cases.
24
Concordia College Journal of Analytical Chemistry 5 (2015), 22-27
Figure 2. Chromatograms for sample sets 1 (upper left), 2 (upper right) and 3 (bottom)
Table 1. Mass % of caffeine for all roasts Bean Roast
Roast Name
HPLC %Mass
Light
India
1.132
Light
India 2
1.425
Light
India 3
1.585
Medium
Peru
1.451
Medium
Peru 2
1.250
Medium
Peru 3
1.437
Dark
MN Mud
1.671
Dark
MN Mud 2
1.403
Dark
MN Mud 3
1.552
25
Avg % Mass (HPLC)
Std. Dev. (HPLC)
1.38
0.23
1.38
0.11
1.54
0.13
Concordia College Journal of Analytical Chemistry 5 (2015), 22-27
Table 2. Average mass % caffeine along with F-test and T-test results Labels
HPLC
UV
F-test
T-test
Roast/Name
n
Ave ± Std Dev
n
Ave ± Std Dev
Table
Calc
Table
Calc
Light/India Medium/Peru Dark/MN Mud
3 3 3
1.380 ± 0.2298 1.379 ± 0.1120 1.542 ± 0.1342
5 4 5
1.406 ± 0.2583 1.442 ± 0.2549 1.540 ± 0.2685
19.25 19.16 19.25
1.264 5.177 4.002
2.447 2.571 2.447
0.1442 0.3912 0.0136
Table 3. F-test and T-test results between coffee roasts F-test
T-Test
Roasts compared
Table
Calc
Table
Calc
Light vs Med
19.00
4.206
2.776
0.006480
Light vs Dark
19.00
2.931
2.776
1.052
Med vs Dark
19.00
1.435
2.776
1.611
Conclusions Analysis of the caffeine content from HPLC and UV yielded statistically similar results. T-tests performed comparing data from both methods s this claim because Tcalc < Ttable for all of the roasts. T-tests comparing the determined caffeine content between roasts from the HPLC data yielded statistically similar results for all roasts because Tcalc < Ttable in all cases. These results go against the widespread belief that dark roast coffee beans have less caffeine content than lighter roast beans because the difference in caffeine content between the roasts was determined to be insignificant by T-tests. This data doesn’t disprove any such adage definitively however, but certainly does appear to begin to build a claim for disproving this long-time notion. Future studies could examine this further by analyzing more samples and different roasts. This study only analyzed three different roasts of coffee beans in three sample runs. Acknowledgements
We would like to thank The Maize restaurant for providing the coffee beans for our experiment. We would like to thank Concordia College for the use of the lab equipment. We would also like to thank Dr. Mark Jensen for his assistance throughout the entire experiment. References
1) Brain, Marshall, Charles W. Bryant and Matt Cunningham. "How Caffeine Works" 01 April 2000. HowStuffWorks.com. [Online] http://science.howstuffworks.com/caffeine.htm (accessed April, 16 2015) 26
Concordia College Journal of Analytical Chemistry 5 (2015), 22-27 2) Simmons, L. How Addiction Works in the Brain. NetPlaces. [Online] http://www.netplaces.com/addiction-recovery/the-nature-of-addiction/howaddiction-works-in-the-brain.htm (accessed April 16, 2015) 3) Schocker, L. 2013. 10 Things You Might Not Know About Caffeine. Huffington Post [Internet]. [cited 2015 April 09] Available from: http://www.huffingtonpost.com/2013/08/25/caffeine-facts_n_3814825.html 4) Food and Drug istration. http://www.nlm.nih.gov/medlineplus/caffeine.html (accessed April 16th, 2015) 5) Mayo Clinic Staff. 2015. Nutrition and healthy eating. Healthy Lifestyle. [Cited 2015 April 09] Available from: http://www.mayoclinic.org/caffeine/ART-20049372?p=1 6) Naegele E. 2013. Determination of Caffeine in Coffee Products According to DIN 20481, United States, Nov. 1st 2013: Agilent Technologies, Inc. Report No.: 59912851EN. Available from http://www.chem.agilent.com/Library/applications/59912851EN.pdf. 7) Belay A, Ture K, Redi M, Asfaw A. 2008. Measurement of caffeine in coffee beans with UV/vis spectrometer. Food Chem 108(1):310-5.
27
Related Documents 3m3m1z
Analysis Of Caffeine Content From Coffee Beans: Hplc/uv-vis Comparison 5ou3e
November 2019 80
Chem35.1 E1 Extraction Of Caffeine From Coffee 4a4366
November 2019 38
Content Analysis 3h2133
April 2022 0
Resistant Starch From Lima Beans 6a1o4f
April 2022 0
Isolation Of Caffeine From A Tea Bag 1t8l
November 2019 47
Comparison Analysis 6e411v
April 2022 0More Documents from "Karinto Rie" 4o2aj
Analysis Of Caffeine Content From Coffee Beans: Hplc/uv-vis Comparison 5ou3e
November 2019 80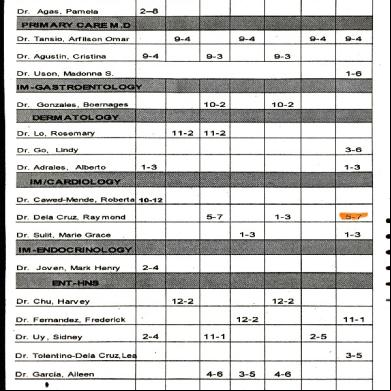
Top Health Med, Sm San Lazaro - Schedule Of The Doctors 2jic
November 2019 78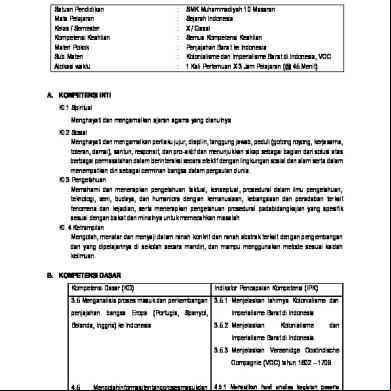
Tugas Ppg Rpp Sejarah Smk Kd 3.5 (puryanti) 1ec5v
September 2020 0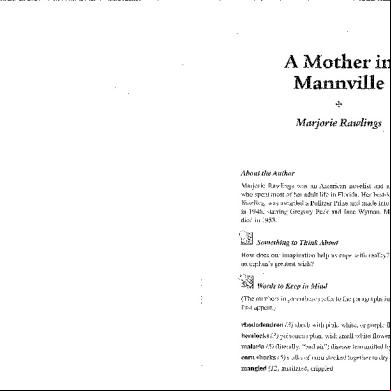
A+mother+in+manville 132j5p
November 2019 33
List Game Asl (1) 49s3r
October 2021 0