Bollinger Band__ Definition _ Investopedia 2ze6a
This document was ed by and they confirmed that they have the permission to share it. If you are author or own the copyright of this book, please report to us by using this report form. Report 3b7i
Overview 3e4r5l
& View Bollinger Band__ Definition _ Investopedia as PDF for free.
More details w3441
- Words: 1,399
- Pages: 4
Bollinger Band?? Definition | Investopedia Search Investopedia
DICTIONARY #
A
INVESTING B
C
D
TRADING E
F
PERSONAL FINANCE
MARKETS G
H
I
J
K
WEALTH MANAGEMENT L
M
N
Symbol
FINANCIAL ADVISORS O
P
EXAM PREP Q
R
SearchSearch
11/30/2015
Free Annual Reports |
TUTORIALS
S
T
U
Bollinger Band®
VIDEO V
W
X
AA
You may also like: Does Warren Buffett own the same stock as you?
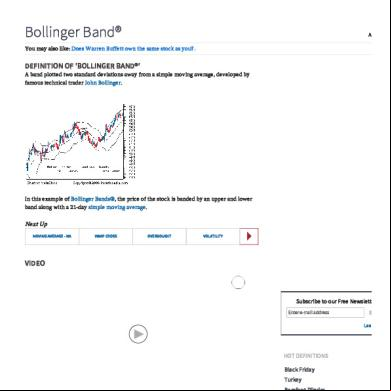
DEFINITION OF 'BOLLINGER BAND®' A band plotted two standard deviations away from a simple moving average, developed by famous technical trader John Bollinger. Bollinger.
In this example of Bollinger Bands®, Bands®, the price of the stock is banded by an upper and lower band along with a 21-day simple moving average. average.
Next Up MOVING AVERAGE - MA
VWAP CROSS
OVERBOUGHT
VOLATILITY
VIDEO
Subscribe to our Free Newsletters! Enter e-mail address
Sign Up
Learn More »
HOT DEFINITIONS Black Friday Turkey Barefoot Pilgrim Quick Ratio
BREAKING DOWN 'BOLLINGER BAND®'
Black Tuesday
Because standard deviation is a measure of volatility, Bollinger Bands® adjust themselves to the market conditions. When the markets become more volatile, the bands widen (move further away from the average), and during less volatile periods, the bands contract (move closer to the average). The tightening of the bands is often used by technical traders as an early indication that the volatility is about to increase sharply.
Black Monday
http://www.investopedia.com//b/bollingerbands.asp
1/4
11/30/2015
Bollinger Band?? Definition | Investopedia
early indication that the volatility is about to increase sharply.
This is one of the most popular technical analysis techniques. The closer the prices move to the upper band, the more overbought the market, and the closer the prices move to the lower band, the more oversold the market. Want to know more? Read The Basics Of Bollinger Bands Refine Your Financial Vocabulary Gain the Financial Knowledge You Need to Succeed. Investopedia’s FREE Term of the Day helps you gain a better understanding of all things financial with technical and easy-tounderstand explanations. Click here to begin developing your financial language with this daily newsletter.
RELATED Moving Average - MA
VWAP Cross
Overbought
Oversold
Volatility
Technical Analysis
A widely used indicator in technical analysis that helps smooth ...
1. A situation in which the demand for a certain asset unjustifiably ...
1. A statistical measure of the dispersion of returns for a given ...
A trading indicator that occurs when the current price crosses ...
1. A condition in which the price of an underlying asset has ...
A method of evaluating securities by analyzing statistics generated ...
Trading Center
RELATED ARTICLES ACTIVE TRADING
Tales From The Trenches: Location Is Everything When a candle pattern re-occurs near a moving average, it may indicate future or resistance.
TRADING STRATEGIES
Using Compound Indicators To Predict Market Fluctuations Learn how to combine average true range, simple moving average and Bollinger band indicators to gauge market volatility.
Partner Links FREE Award-Winning Software - Ninja Trader Are you interested in generating income? Exclusive: Learn the "House Odds" of Investing
FOREX EDUCATION
The "Turn To The Carry" Trade This variation on the turn to trend setup can help longer term traders make more potent trades.
FOREX EDUCATION
Using Bollinger Band® "Bands" To Gauge Trends Find out how this smart tool can help you achieve superior analysis.
FOREX EDUCATION
How To Use The Forex Pure Fade Trade This intraday strategy picks tops and bottoms based on a clear recovery following an extreme move.
TRADING STRATEGIES
Understanding Bollinger Bands In the 1980s, John Bollinger developed the technique of using a moving
http://www.investopedia.com//b/bollingerbands.asp
2/4
11/30/2015
Bollinger Band?? Definition | Investopedia In the 1980s, John Bollinger developed the technique of using a moving average with two trading bands above and below it. Learn how this indicator works, and how you can apply it to your trading. ...
FOREX EDUCATION
Capture Profits Using Bands And Channels Donchian channels, Keltner channels and STARC bands are not as well known as Bollinger bands, but they offer comparable opportunities.
ACTIVE TRADING
Traders: Profit From Other Investors' Fear Learn to pounce on the opportunity that arises when other traders run and hide.
ACTIVE TRADING
Candle Sheds More Light Than The MACD Read the case against this well-established indicator.
ACTIVE TRADING
Enter Profitable Territory With Average True Range Find entry or exit signals or develop a complete system based on this versatile tool.
RELATED FAQS Q: How can I use Bollinger Bands® to trade binary options? A: Bollinger Bands can be used to trade binary options, because they are an effective tool to signal when markets become oversold ... Read Full Answer >>
Q: What is a double Bollinger Bands® strategy? A: A double Bollinger Bands strategy is primarily used as a tool to take advantage of sideways markets. Sideways markets are ... Read Full Answer >>
Q: How do traders use Bollinger Bands® to identify a breakout? A: Traders use Bollinger Bands to identify breakouts by looking for breaks above the upper band on fundamental news and strong ... Read Full Answer >>
Q: Which market indicators reflect volatility in the stock market? A: There are several volatility indicators available for stock traders and analysts to use. Some of the most commonly used ones ... Read Full Answer >>
Q: What is a common strategy traders implement when using the Volume Weighted Average ... A: Using the volume-weighted average price (VWAP) when trading in short-term time frames is highly effective and simple. One ... Read Full Answer >>
Q: Why are STARC Bands important for traders and analysts? A: STARC bands, or Stoller average range channels, provide traders and market analysts with indications of the level of volatility ... Read Full Answer >>
Q: Is using the Donchian channel more risky or more conservative than using Bollinger ... A: Both Donchian Channels and Bollinger Bands are trend-following volatility indicators. They are meant to identify breakouts ... Read Full Answer >>
Q: What does it mean when a stock is trading near the Donchian channel, high or low? A: The Donchian channel is an easy-to-understand moving average indicator. Much like Bollinger Bands, the Donchian system uses ... Read Full Answer >>
Q: Are Bollinger Bands® useful for analyzing securities with very low volatility? A: Technical trader John Bollinger invented Bollinger Bands as a volatility indicator that can be added to a price chart. Bollinger ... Read Full Answer >>
Q: How do I create a trading strategy with Bollinger Bands® and candlesticks? A: Bollinger Bands and candlesticks are popular and effective technical indicators in the trading industry. Bollinger Bands ... Read Full Answer >>
http://www.investopedia.com//b/bollingerbands.asp
3/4
11/30/2015
Bollinger Band?? Definition | Investopedia
Bollinger Bands ... Read Full Answer >>
Q: What is the logic behind using Bollinger Bands® as an indicator of volatility? A: Bollinger Bands are defined by the trading range of their underlying security issue, making them particularly adaptable to ... Read Full Answer >>
Q: How do countertrend trading strategies work? A: Countertrend trading strategies are used to enter a market that may be changing direction or simply to profit from the ordinary ... Read Full Answer >>
Q: Are Bollinger Bands® useful for analyzing highly volatile securities? A: Bollinger Bands are specifically designed to adjust to changes in a security's trading range, making them particularly useful ... Read Full Answer >>
BROWSE BY TOPIC:
Bollinger Bands
Technical Analysis
Technical Indicators
YOU MAY ALSO LIKE
Expert guide on how your car engine works.
Citi: English Proficiency Ensures Consistency
5 Shoe Mistakes You Could Be Making
Singapore's street food hidden gems
Shell in Malaysia
Why English Matters by TOEIC
Esquire Singapore
TripAdvisor Australia
Fraunhofer: English Is the Language of Science
15 Richest Pro Gamers
AEON Fined RM140,000 For Profiteering | iMoney
Bankrupt But Still Worth Millions? | iMoney
iMoney Malaysia
iMoney Malaysia
Infowat
Why English Matters by TOEIC
Recommended by
Search Investopedia
DICTIONARY:
#
A
B
C
D
E
F
G
H
I
J
K
L
M
N
CONTENT LIBRARY Articles
P
Q
R
S
T
U
V
W
X
CONNECT WITH INVESTOPED Videos
Free Annual Reports
Tutorials
Slideshows
Stock Simulator
FXtrader
FAQs
Calculators
Exam Prep Quizzer
Chart Advisor
With Us
Write For Us
Email Deployment
Stock Analysis
Net Worth Calculator
WORK WITH INVESTOPEDIA License Content
O
Symbol
Us
Careers
Sign Up for Our Free Newsletters!
© 2015, Investopedia, LLC. All Rights Reserved Of Use
http://www.investopedia.com//b/bollingerbands.asp
4/4
DICTIONARY #
A
INVESTING B
C
D
TRADING E
F
PERSONAL FINANCE
MARKETS G
H
I
J
K
WEALTH MANAGEMENT L
M
N
Symbol
FINANCIAL ADVISORS O
P
EXAM PREP Q
R
SearchSearch
11/30/2015
Free Annual Reports |
TUTORIALS
S
T
U
Bollinger Band®
VIDEO V
W
X
AA
You may also like: Does Warren Buffett own the same stock as you?
DEFINITION OF 'BOLLINGER BAND®' A band plotted two standard deviations away from a simple moving average, developed by famous technical trader John Bollinger. Bollinger.
In this example of Bollinger Bands®, Bands®, the price of the stock is banded by an upper and lower band along with a 21-day simple moving average. average.
Next Up MOVING AVERAGE - MA
VWAP CROSS
OVERBOUGHT
VOLATILITY
VIDEO
Subscribe to our Free Newsletters! Enter e-mail address
Sign Up
Learn More »
HOT DEFINITIONS Black Friday Turkey Barefoot Pilgrim Quick Ratio
BREAKING DOWN 'BOLLINGER BAND®'
Black Tuesday
Because standard deviation is a measure of volatility, Bollinger Bands® adjust themselves to the market conditions. When the markets become more volatile, the bands widen (move further away from the average), and during less volatile periods, the bands contract (move closer to the average). The tightening of the bands is often used by technical traders as an early indication that the volatility is about to increase sharply.
Black Monday
http://www.investopedia.com//b/bollingerbands.asp
1/4
11/30/2015
Bollinger Band?? Definition | Investopedia
early indication that the volatility is about to increase sharply.
This is one of the most popular technical analysis techniques. The closer the prices move to the upper band, the more overbought the market, and the closer the prices move to the lower band, the more oversold the market. Want to know more? Read The Basics Of Bollinger Bands Refine Your Financial Vocabulary Gain the Financial Knowledge You Need to Succeed. Investopedia’s FREE Term of the Day helps you gain a better understanding of all things financial with technical and easy-tounderstand explanations. Click here to begin developing your financial language with this daily newsletter.
RELATED Moving Average - MA
VWAP Cross
Overbought
Oversold
Volatility
Technical Analysis
A widely used indicator in technical analysis that helps smooth ...
1. A situation in which the demand for a certain asset unjustifiably ...
1. A statistical measure of the dispersion of returns for a given ...
A trading indicator that occurs when the current price crosses ...
1. A condition in which the price of an underlying asset has ...
A method of evaluating securities by analyzing statistics generated ...
Trading Center
RELATED ARTICLES ACTIVE TRADING
Tales From The Trenches: Location Is Everything When a candle pattern re-occurs near a moving average, it may indicate future or resistance.
TRADING STRATEGIES
Using Compound Indicators To Predict Market Fluctuations Learn how to combine average true range, simple moving average and Bollinger band indicators to gauge market volatility.
Partner Links FREE Award-Winning Software - Ninja Trader Are you interested in generating income? Exclusive: Learn the "House Odds" of Investing
FOREX EDUCATION
The "Turn To The Carry" Trade This variation on the turn to trend setup can help longer term traders make more potent trades.
FOREX EDUCATION
Using Bollinger Band® "Bands" To Gauge Trends Find out how this smart tool can help you achieve superior analysis.
FOREX EDUCATION
How To Use The Forex Pure Fade Trade This intraday strategy picks tops and bottoms based on a clear recovery following an extreme move.
TRADING STRATEGIES
Understanding Bollinger Bands In the 1980s, John Bollinger developed the technique of using a moving
http://www.investopedia.com//b/bollingerbands.asp
2/4
11/30/2015
Bollinger Band?? Definition | Investopedia In the 1980s, John Bollinger developed the technique of using a moving average with two trading bands above and below it. Learn how this indicator works, and how you can apply it to your trading. ...
FOREX EDUCATION
Capture Profits Using Bands And Channels Donchian channels, Keltner channels and STARC bands are not as well known as Bollinger bands, but they offer comparable opportunities.
ACTIVE TRADING
Traders: Profit From Other Investors' Fear Learn to pounce on the opportunity that arises when other traders run and hide.
ACTIVE TRADING
Candle Sheds More Light Than The MACD Read the case against this well-established indicator.
ACTIVE TRADING
Enter Profitable Territory With Average True Range Find entry or exit signals or develop a complete system based on this versatile tool.
RELATED FAQS Q: How can I use Bollinger Bands® to trade binary options? A: Bollinger Bands can be used to trade binary options, because they are an effective tool to signal when markets become oversold ... Read Full Answer >>
Q: What is a double Bollinger Bands® strategy? A: A double Bollinger Bands strategy is primarily used as a tool to take advantage of sideways markets. Sideways markets are ... Read Full Answer >>
Q: How do traders use Bollinger Bands® to identify a breakout? A: Traders use Bollinger Bands to identify breakouts by looking for breaks above the upper band on fundamental news and strong ... Read Full Answer >>
Q: Which market indicators reflect volatility in the stock market? A: There are several volatility indicators available for stock traders and analysts to use. Some of the most commonly used ones ... Read Full Answer >>
Q: What is a common strategy traders implement when using the Volume Weighted Average ... A: Using the volume-weighted average price (VWAP) when trading in short-term time frames is highly effective and simple. One ... Read Full Answer >>
Q: Why are STARC Bands important for traders and analysts? A: STARC bands, or Stoller average range channels, provide traders and market analysts with indications of the level of volatility ... Read Full Answer >>
Q: Is using the Donchian channel more risky or more conservative than using Bollinger ... A: Both Donchian Channels and Bollinger Bands are trend-following volatility indicators. They are meant to identify breakouts ... Read Full Answer >>
Q: What does it mean when a stock is trading near the Donchian channel, high or low? A: The Donchian channel is an easy-to-understand moving average indicator. Much like Bollinger Bands, the Donchian system uses ... Read Full Answer >>
Q: Are Bollinger Bands® useful for analyzing securities with very low volatility? A: Technical trader John Bollinger invented Bollinger Bands as a volatility indicator that can be added to a price chart. Bollinger ... Read Full Answer >>
Q: How do I create a trading strategy with Bollinger Bands® and candlesticks? A: Bollinger Bands and candlesticks are popular and effective technical indicators in the trading industry. Bollinger Bands ... Read Full Answer >>
http://www.investopedia.com//b/bollingerbands.asp
3/4
11/30/2015
Bollinger Band?? Definition | Investopedia
Bollinger Bands ... Read Full Answer >>
Q: What is the logic behind using Bollinger Bands® as an indicator of volatility? A: Bollinger Bands are defined by the trading range of their underlying security issue, making them particularly adaptable to ... Read Full Answer >>
Q: How do countertrend trading strategies work? A: Countertrend trading strategies are used to enter a market that may be changing direction or simply to profit from the ordinary ... Read Full Answer >>
Q: Are Bollinger Bands® useful for analyzing highly volatile securities? A: Bollinger Bands are specifically designed to adjust to changes in a security's trading range, making them particularly useful ... Read Full Answer >>
BROWSE BY TOPIC:
Bollinger Bands
Technical Analysis
Technical Indicators
YOU MAY ALSO LIKE
Expert guide on how your car engine works.
Citi: English Proficiency Ensures Consistency
5 Shoe Mistakes You Could Be Making
Singapore's street food hidden gems
Shell in Malaysia
Why English Matters by TOEIC
Esquire Singapore
TripAdvisor Australia
Fraunhofer: English Is the Language of Science
15 Richest Pro Gamers
AEON Fined RM140,000 For Profiteering | iMoney
Bankrupt But Still Worth Millions? | iMoney
iMoney Malaysia
iMoney Malaysia
Infowat
Why English Matters by TOEIC
Recommended by
Search Investopedia
DICTIONARY:
#
A
B
C
D
E
F
G
H
I
J
K
L
M
N
CONTENT LIBRARY Articles
P
Q
R
S
T
U
V
W
X
CONNECT WITH INVESTOPED Videos
Free Annual Reports
Tutorials
Slideshows
Stock Simulator
FXtrader
FAQs
Calculators
Exam Prep Quizzer
Chart Advisor
With Us
Write For Us
Email Deployment
Stock Analysis
Net Worth Calculator
WORK WITH INVESTOPEDIA License Content
O
Symbol
Us
Careers
Sign Up for Our Free Newsletters!
© 2015, Investopedia, LLC. All Rights Reserved Of Use
http://www.investopedia.com//b/bollingerbands.asp
4/4
Related Documents 3m3m1z
Bollinger Band__ Definition _ Investopedia 2ze6a
November 2022 0
Balance Sheet Definition _ Investopedia 2zj4d
November 2019 55
Contract Logistics Definition _ Investopedia 6ero
October 2022 0
Financial Statements Definition _ Investopedia 176i3c
November 2022 0
Definition Of Investopedia 701o5l
November 2022 0
Bollinger Band Magic 24e17
November 2021 0More Documents from "Tecwyn Lim" 2m6n4p

Non-compete Clause - Wikipedia, The Free Encyclopedia 504x2r
November 2019 19
Bollinger Band__ Definition _ Investopedia 2ze6a
November 2022 0
2014 Cfa Level 3 Secret Sauce.pdf 15552q
October 2019 107
Classification Of Discontinuities.pdf 55a3
November 2019 101
Project Management Process Groups A Case Study 6p5f2o
April 2022 0