Discovering Density 1u1f31
This document was ed by and they confirmed that they have the permission to share it. If you are author or own the copyright of this book, please report to us by using this report form. Report 3b7i
Overview 3e4r5l
& View Discovering Density as PDF for free.
More details w3441
- Words: 1,210
- Pages: 4
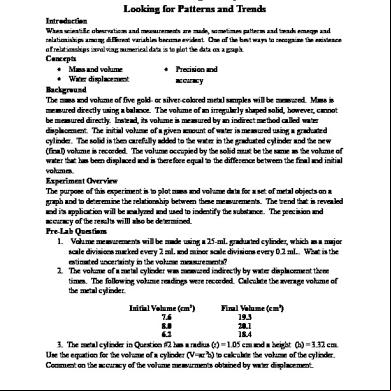
Discovering Density Looking for Patterns and Trends Introduction When scientific obesrvations and measurements are made, sometimes patterns and trends emerge and relationiships among different variables become evident. One of the best ways to recognize the existence of relationships involving numerical data is to plot the data on a graph.
Concepts Mass and volume Precision and Water displacement accuracy Background The mass and volume of five gold- or silver-colored metal samples will be measured. Mass is measured directly using a balance. The volume of an irregularly shaped solid, however, cannot be measured directly. Instead, its volume is measured by an indirect method called water displacement. The initial volume of a given amount of water is measured using a graduated cylinder. The solid is then carefully added to the water in the graduated cylinder and the new (final) volume is recorded. The volume occupied by the solid must be the same as the volume of water that has been displaced and is therefore equal to the difference between the final and initial volumes. Experiment Overview The purpose of this experiment is to plot mass and volume data for a set of metal objects on a graph and to deteremine the relationship between these measurements. The trend that is revealed and its application will be analyzed and used to indentify the substance. The precision and accuracy of the results willl also be determined. Pre-Lab Questions 1. Volume measurements will be made using a 25-mL graduated cylinder, which as a major scale divisions marked every 2 mL and minor scale divisions every 0.2 mL. What is the estimated uncertainty in the volume measurements? 2. The volume of a metal cylinder was measured indirectly by water displacement three times. The following volume readings were recorded. Calculate the average volume of the metal cylinder. Initial Volume (cm3) Final Volume (cm3) 7.6 19.3 8.0 20.1 6.2 18.4 3. The metal cylinder in Question #2 has a radius (r) = 1.05 cm and a height (h) = 3.32 cm. Use the equation for the volume of a cylinder (V=πr2h) to calculate the volume of the cylinder. Comment on the accuracy of the volume measurments obtained by water displacement.
Materials
Metal shot, 50-60 g Beaker, 100-mL Paper Towels Water
Balance, centigram (0.01 g precision) Graduated cylinder, 25-mL Pen for labeling Weighing dishes or small conainters 5
Saftey Precautions Although the materials in this experiment are considred nonhazardous, follow all normal laboratory safety guidelines. Always wear chemical splash goggles when working with glassware in the lab. Procedure 1. Obtain 50-60 g of silver or gold colored metal shot in a 100-mL beaker. In the Data Table, cifcle whether the meatl is “silver” or “gold”. 2. Label a set of weighing dishes or small conatiners 1-5. 3. Tare (“zero”) weighing dish #1 on the electronic balance and add about one – fifh of the metal shot to the dish. Measure the mass of sample #1 (it should be between 8 and 15 g). Record the mass of sample #1 in the Data Table. 4. Repeat step 3 to divide the metal shot among the other four weighing dishes. Vary the sample sizes so they are not all the same mass. Thus, if the first sample is 8 g, make the next sample about 10 g, etc. Do not mix up the samples!!! 5. Obtain a clean, 25-mL graduated cylinder and add approximatly 10 mL of water to the cylinder. 6. Measure the intial volume of water in the cylinder to the nearest 0.1 mL and record the value for sample #1 in the Data Table. Note: Use the units cm3 for the volume measurements. Recall, 1 mL = 1 cm3. 7. Carefully add sample #1 to the water in the graduated cylinder. The best way to do this is to tip the cylinder at a slight angle and gently slide the metal pieces into the water so that the water does not splash or splatter (and the galss cylinder does not break). Record the final volume (volumer of water plus the sample) in the Data Table. 8. Subtract the initial volume from the final volume to calculate the volume of sample #1. Record this value in the Data Table. 9. Repeat steps 6-8 for each of the reamining samples. Do NOT remove prior samples from the cylinder between each measurement. Before adding a new sample to the cylinder, measure the new “initial” volume in the graduated cylinder. This may not always be precisely the same as the previous final volume reading. Record initial and final volume measurements and the volume of each subsequent sample in the Data Table.
Discovering Denisty Data Table Silver or Gold?
Sample
Mass (g)
Volume (initial), cm3
Volume (final) cm3
Volume (sample) cm3
1 2 3 4 5
Graphing the Data Plot the mass and volume data for samples 1-5 on the following graph. Each sample is represented by one point. Use the horizontal axis for the volume and the vertical axis for the mass. Label each axis-don’t forget the units-and make sure the scale is clearly marked. Do NOT play “connect-the-dots” with the data points.
Post-Lab Questions 1. Does it make sense that any trend or pattern in the data should include (0,0) as a point? Explain your reasoning.
2. What kind of trend or pattern is obvious in the data? Is tehre a consistent relationshipo between the volume and mass measurements? Explain. 3. Based on your answers to question #1 and 2, draw a line through the data points. The best way to do this is to place a ruler or straightedge at an angle over the data points – find the “best-fit” straight line that includes as many points as possible. 4. Caclulate the slope of the “best-fit” line. Show all of your work! What are the unts of the slope? What physical property is represented by the slope? 5. Are there any data points that seem out of place in the set? Do you think all of the metal pieces in your sample set are made of the same metal? Explain. 6. Compare your value of the slope with that found by one other student grouop using a differently colored metal (i.e. if your sample were silver, compare your data with a group that measured gold samples). Are there values of the slope the same? Why or why not? 7. Use the following information to determine the probably identity of your metal. What type of metal do you have? Metal Gold Silver Iron Tin Zinc Copper Brass Slope 19.3 10.5 7.9 7.3 7.1 8.9 8.5 (g/cm3) 8. Assuming that the indetification of your metal is valid, use the following equation to calculate the percent error in your measurement of the slope and the physical property it represents. The percent error measures the accuracy of your results. Comment on the accuracy of this procedure and discuss the sources of experimental error.
percent error =
x 100%
9. Density can be calculated directly by dividing the mass of an object by its volumer. Using the mass and volume measurements recorded in the Data Table, calculate the denisty for each sample., the average density, and the difference between each density value and the average value. Comment on the precision of the density determination.
Related Documents 3m3m1z
Discovering Density 1u1f31
December 2019 55
Discovering Dna 721j5d
December 2019 45
Discovering The Atom 59252g
October 2019 66
Upside Down: Discovering Creation 2u4n4q
September 2021 0
Discovering The Stm32 Microcontroller 47rb
November 2019 54
Discovering Computers 2012 1am5z
October 2022 0More Documents from "Navdeep Singh" 1u5s8
Unit-2 Parameters Of Sustainable Development.pdf 234e4j
October 2019 57
Unit-6 Patterns Of Industrialisation.pdf 2a452n
November 2019 35
Discovering Density 1u1f31
December 2019 55
Kfc Business Plan 5t3ao
July 2022 0
Catia - Wireframe And Surface Design Exercises 3c70e
November 2019 416