Ftq Overview 2u2pz
This document was ed by and they confirmed that they have the permission to share it. If you are author or own the copyright of this book, please report to us by using this report form. Report 3b7i
Overview 3e4r5l
& View Ftq Overview as PDF for free.
More details w3441
- Words: 6,073
- Pages: 65
FTQ
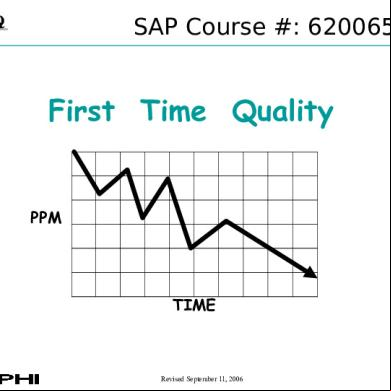
SAP Course #: 62006505
First Time Quality
PPM
TIME
Revised September 11, 2006
FTQ
First Time Quality
What First Time Quality Is Why It Is Important Why We Need to Measure It How to Calculate It FTQ Deployment, Evaluation and Improvement Process Responsibilities The Structured Approach Steps The Basic Quality Tools How to Apply the Quality Tools Monitoring and Reporting Class Exercise
Revised September 11, 2006
2
FTQ
First Time Quality
What is First Time Quality? First Time Quality is a measure of the number of pieces rejected in a manufacturing process versus the total number of pieces attempted.
REJEC TS
Revised September 11, 2006
3
FTQ
First Time Quality
Define ALARM LIMITS
A structured approach
Catch and Count Defects
1
2
React to ALARM LIMITS Reaction Plan
Follow Reaction Plan
ZERO Defects Forward Initiate Structured Problem Solving Voice of the Customer Revised September 11, 2006
4
FTQ
First Time Quality
FTQ can be viewed as a two phase approach: Immediate action and containment Whenever alarm limits are exceeded Helps ensure customer protection
Continual Improvement Management objective to reduce quantity of rejects and operational cost Leadership MUST ensure, and follow-up with implementation of FTQ in their facility to be successful
Revised September 11, 2006
5
FTQ
First Time Quality
Why is FTQ important? Because if we don’t make good parts the first time, we have to “inspect in” quality We know inspection is at best 85% effective Therefore, anytime FTQ is greater than 0, we are dependent on inspection to protect the customer
To reduce manufacturing costs and defects through continual improvement (FTQ Tracker or Step Down Chart are tools to utilize)
To monitor process stability and react quickly to potential issues (Alarm limits and process monitoring sheets) Revised September 11, 2006 6
FTQ
First Time Quality
FTQ should be viewed as a tool to facilitate operational improvement in:
Quality
PPM TIME
Cost
Revised September 11, 2006
7
FTQ
First Time Quality
FTQ is Key to our Success to turn this
into this!
PPM
TIME
Revised September 11, 2006
8
FTQ
First Time Quality
Why does FTQ need to be measured? Main
Reasons:
It
is the early signal that a process is out of control It allows us to respond to problems internally before they reach our customers It measures improvement from corrective actions implemented
If we don’t fix our quality problems internally, we will never be able to fix our external customer issues Revised September 11, 2006
9
FTQ
First Time Quality The fatal flaw of inspection Catch Defects
Inspection is like a filter.
D
D
Filter
Inspection misses some defects Defects not caught
D
Problem
Voice of the Customer
Revised September 11, 2006
10
FTQ
Inspection Exercise
Count the Number of ‘F’s contained in the paragraph below (60sec)
THE NECESSITY OF TRAINING FARMHANDS FOR FIRST CLASS FARMS IN THE FATHERLY HANDLING OF FARM LIVESTOCK IS FOREMOST IN THE MINDS OF FARM OWNERS. SINCE THE FOREFATHERS OF THE FARM OWNERS TRAINED THE FARMHANDS FOR THE FIRSTCLASS FARMS IN THE FATHERLY HANDLING OF FARM LIVESTOCK. THE FARMS OWNERS FEEL THEY SHOULD CARRY ON WITH THE FAMILY TRADITION OF TRAINING FARMHANDS OF FIRST-CLASS FARMS IN THE FATHERLY HANDLING OF FARM LIVESTOCK BECAUSE THEY BELIEVE IT IS THE BASIS OF GOOD FUNDAMENTAL FARM MANAGEMENT.
Revised September 11, 2006
11
FTQ
Inspection Exercise
Total of 36 F’s THE NECESSITY OF TRAINING FARMHANDS FOR FIRST CLASS FARMS IN THE FATHERLY HANDLING OF FARM LIVESTOCK IS FOREMOST IN THE MINDS OF FARM OWNERS. SINCE THE FOREFATHERS OF THE FARM OWNERS TRAINED THE FARMHANDS FOR THE FIRSTCLASS FARMS IN THE FATHERLY HANDLING OF FARM LIVESTOCK. THE FARMS OWNERS FEEL THEY SHOULD CARRY ON WITH THE FAMILY TRADITION OF TRAINING FARMHANDS OF FIRST-CLASS FARMS IN THE FATHERLY HANDLING OF FARM LIVESTOCK BECAUSE THEY BELIEVE IT IS THE BASIS OF GOOD FUNDAMENTAL FARM MANAGEMENT.
Revised September 11, 2006
12
FTQ
First Time Quality
How is First Time Quality calculated? FTQ is reported in parts per million (PPM) defective It can be measured at any step in the manufacturing process where parts are rejected especially where the defect is originated. It is calculated by counting the number of pieces rejected versus the total number of pieces attempted The total number of pieces attempted includes all good pieces produced plus all pieces rejected Pieces rejected are all parts scrapped or reworked prior to usage by subsequent processes. The actual calculation looks like this:
Number of Pcs. Rejected Total Number of Pcs. Attempted
X 1,000,000 = FTQ PPM
Revised September 11, 2006
13
FTQ
First Time Quality
How is First Time Quality calculated?
Tally Sheet
An example at the cell level: Cell “A” has six operations
1
2
3
4
5
28
6 16
Reject data is collected at operations 3 and 6. Cell “A” produced 1040 good pieces during the first hour. At OP.3, 28 pcs. were rejected. At OP.6, 16 pcs. were rejected. What is the FTQ in PPM for Cell A? 28 + 16 44 1040 + 28 + 16 =1084 X 1,000,000 = 40,590 PPM FTQ Revised September 11, 2006
14
FTQ
First Time Quality
What First Time Quality Is Why It Is Important Why We Need to Measure It How to Calculate It
FTQ Deployment, Evaluation and Improvement Process Responsibilities The Structured Approach The Basic Quality Tools How to Apply the Quality Tools Monitoring and Reporting
Class Exercise
Revised September 11, 2006
15
FTQ
FTQ Improvement Process Stakeholder involvement CELL
Plant A CELL 1
2
3
4
5
6
7
8
N
Plt B
OPERATOR
OPERATOR
OPERATOR
OPERATOR
OPERATOR
Plt C TEAM LEADER
CROSSFUNCTIONAL TEAM
PROCESS ENGINEERING
OPERATIONS
PRODUCT ENGINEERING
Potential : - TEAM LEADER - OPERATIONS/MANUFACTURING - QUALITY ENGINEER - PROCESS ENGINEER - INDUSTRIAL ENGINEER - MAINTENANCE - PRODUCT ENGINEER - SUPPLIER QUALITY
QUALITY
MAINTENANCE
PC&L
PLANT MANAGER
Revised September 11, 2006
16
FTQ
FTQ Improvement Process Typical Responsibilities Flowchart CFT
PROCESS
QUALITY ENGINEER
OPERATIONS
PROCESS ENGINEER
PRODUCT ENGINEER
MAINTENANCE
INDUSTRIAL ENGINEER
DEFINE REACTION PLAN & ALARM LIMITS
IDENTIFY & COUNT DISCREPANT PARTS
IMPLEMENT ALARM REACTION PLAN (IF EXCEEDED) RECORD DATA
ANALYZE DATA
SELECT & PLAN IMPROVEMENT
IMPLEMENT IMPROVEMENT
EVALUATE
INSTITUTIONALIZE LESSONS LEARNED
LEAD
Revised September 11, 2006
17
FTQ
FTQ Implementation
Delphi SQ or SDE Responsibilities Ensure supplier understands, and if necessary, obtains appropriate training on the FTQ Improvement process Monitor implementation progress during FTQ activities Conduct 5 step site evaluation for FTQ implementation Set stage for improvement activities Outline plan of attack Document improvement plan ( i.e. through an A3) Revised September 11, 2006
18
FTQ
FTQ Improvement Process Overall
IMPLEMENT ALARM REACTION PLAN
NO
YES DEFINE REACTION PLAN & ALARM LIMITS
IDENTIFY & COUNT DISCREPANT PARTS
ALARM EXCEEDED ?
NO
RECORD DATA
SELECT & PLAN IMPROVEMENT
IMPLEMENT IMPROVEMENT
EVALUATE
NEW LEVEL OF QUALITY?
YES
INSTITUTIONALIZE LESSONS LEARNED TOOLS: - PFMEA - PROCESS CONTROL PLAN - LOOK-ACROSS-CHART - 5 WHY'S
TOOL: TOOL: TOOLS: EXAMPLES: TOOLS: - CROSS-FUNCTIONAL - ACTION PLAN - RUN CHART - CONTROL - PARETO - CAUSE & EFFECT TEAMS CHART (FISHBONE) - CHANGE BOARDS - CONCENTRATION - RPN REDUCTION DIAGRAM - STATISTICAL ENGINEERING - FLOW CHART PROJECTS - GATE CHART - HISTOGRAM - SCATTER ACTION PLAN: DIAGRAM - WHAT, WHEN, WHO - CHECK SHEET - 5 WHY'S
TOOLS FOR IDENTIFICATION: - PROCESS CONTROL PLAN - BOUNDARY SAMPLES TOOLS FOR COUNTING: - PARTS COUNTERS - TALLY SHEETS - SIZED CONTAINERS
IDENTIFY
SELECT
ANALYZE DATA
CONTAIN
ANALYZE
PLAN
IMPLEMENT
CORRECT
EVALUATE
PREVENT
Delphi Problem Solving Process Revised September 11, 2006
19
FTQ
First Time Quality
Define ALARM LIMITS
A structured approach
Catch and Count Defects
1
2
React to ALARM LIMITS Reaction Plan
Follow Reaction Plan
ZERO Defects Forward Initiate Structured Problem Solving Voice of the Customer Revised September 11, 2006
20
FTQ
FTQ Improvement Process
Define alarm limits and reaction plan Alarm limits must be based on current process reject data or available data from Machine qualification runs, Run at Rate, historical data, etc. Need to collect data long enough to ensure you understand the types and quantities of defects that fall out from your current process. Limits for common cause (chronic) rejects may be statistically calculated Understand process and expected defects (what types and quantities of defects) Determine the process normal range of variation by charting the reject data over time
Revised September 11, 2006
21
FTQ
FTQ Improvement Process
Define alarm limits and reaction plan Limits for special cause (non chronic) rejects must be set at one piece Limits must be communicated to operators so they can react If alarm limits are exceeded, there must be a documented reaction plan which includes containment of product and process corrections. Employees may find clever ways to identify abnormal process state as the process matures The immediate action taken is the most important step in containing the problem until it has been eliminated and verified Revised September 11, 2006
22
Alarm Limit Calculation using np Chart
FTQ 20 25 18
NP Charting for FTQ
Defects Pareto
100
16 20 14
UCL=16.1
90 80
Nonconforming
UCL=
12 15 10
70
avg= 9.8
60
108 6
avg=
54 2
LCL=
50 40 30
LCL=3.4
20 10
00
0
8 14 9 1017 11 1322 14 11 2 32 4 35 64 7 5 8 9 6 10 11712 13 15 16 18 1912 20 21 23 2415 25 16 17 18 19 20 21 22 23 24 25 Subgroups ( Days) Hours or Days Non-conforming 18 Sample Size (Avg) Defects wing mark wing / body fold wrong paint dot paint location wrong or no clip Total nonconforming: Production PPM Defective np
1 8
2 10
3 9
4 11
5 9
2 3 2
1 2 2 3 2 10 18
5 1 1
4 2 5
2 5 1
11 18
1 9 20
1 8 18
2 9 19
np1+np2+…..npk
6 8
1 2 4 1 8 18
7 6
8 8
9 7
10 11
11 12
12 11
13 13
14 18
15 17
16 12
17 9
18 10
1 2
3 2
4 2
2 5 3
1 3 4
3 4 3 3
2 1 6 2 6 17 17
1 4
2 5
3 8 18
1 5 3 7 2 18 18
1 2 8
2 1 6 17
2 2 5 2 1 12 18
2 2 9 18
2 1 10 19
1 7 18
1 11 19
3 11 19
13 19
1 12 18
19 7
20 8
21 5
6 1
7 1
1 3
7 18
8 20
1 5 18
22 9
23 11
24 8
25 7
1 1 1 2 4 9 18
1 2 4 4
2 3
1 3 3
3 8 18
7 19
11 20
where np= number nonconformin, k= subgroups
k n = avg sample size (18) np
"=SUM(C3:AA3)/25" np = number nonconforming
UCLnp k = subgroups UCLnp = 0
(25)
__ np = np1+np2+…..npk LCLnp LCLnp = k 0
UCL=np + 3* = 0 =
0
LCL=np - 3* Revised September 11, 2006
(np(1-np/n)) (np(1-np/n))
23
FTQ
Alarm Limit Calculation using np calculation and Stop Light control method A
1.-
Broken case
B
CELL:
Quality
(U C L )
T u rn o s
DEFECTS
In d ic a d o r
DEPT:
AREA: HVAC
Monday
259W
Tuesday
WEEK: Wednesday
to Feb 5
Jan 30 Thursday
8 8
C A
2.-
Wrong assembled case
B C A
3.-
Damaged cases
B C A
4.-
Missing screws
B C A
5.-
Warped cases
B C A
6.-
Vibration
B C A
7.-
Wrong assembled thermistor
B C A
8.-
Damaged evaporator pipes
B C A
9.-
Damaged mounting plate
B C A
10.- Air leak
B C
11.11.11.12.12.12.-
5 5 5 4 4 4 4 4 4 4 4 4 3 3 3 3 3 3 3 3 3 2 2 2 2 2 2
A B
NC
C A B
NC
C
Instructions 1.-
Mark to be used by each shift:
GP-12 X (Red X)
Final insp./Rework/Process/Scrap
X (Black X)
2.- Team: a) Shift leader will give follow up to each defect recorded. b) When a defect reaches the yellow color limits, apply supervisor's reaction protocol; if the red co reaction protocol. c) The Quality auditor is responsible for checking the squares with the appropriate color in case that a defect is detected. d) This format is for one we responsible for archiving this format on a weekly basis. f) The Quality engineer is responsible for monthly updating the reaction and control limits. 3.-
Control limits calculation for non chronic defects (np):
a)
b)
Calcular avarage del numero por defecto np = np1 + np2 + np3 + ….. + npk np = Son los numeros de defectos de cada subgrupo de k k Calcular limites de control superior e inferior (UCL, LCL)
UCL
=
np + 3
np ( 1 - np / n )
=
np
+
3
np ( 1 - p )
Revised September 11, 2006
24
FTQ
Example: Rejected Parts Counter
Quality Alarm Limit: The counter is flipped for each defect. The color will change from green to yellow to red. Yellow indicates action required and red will stop the process. Small white tags are placed with each defective part to identify the specific defect. Revised September 11, 2006
25
FTQ
FTQ Improvement Process
Identify and count rejected parts Operators must have sufficient tools and skills in order to identify product discrepancies It is recommended that rejected parts be removed from the cell station at a defined frequency so they may be counted and categorized by defect or rework code Tools to enhance the operator’s ability to identify product discrepancies include:
Boundary Samples Illustrations Photographs Gages
Tools for counting rejected parts include: Parts Counters Tally Sheets Sized Containers
Revised September 11, 2006
26
FTQ
FTQ Improvement Process Special Cause (Non-chronic) Rejects
FAILURE REACT
MODE HAS A KNOWN ASSIGNABLE CAUSE.
AT FIRST OCCURRENCE
IMMEDIATE BASED
FIX / CORRECTION.
ON OPERATOR CERTIFICATION PROGRAM.
STOP & Contain FIX
S F S
START
Revised September 11, 2006
27
FTQ
FTQ Improvement Process Common Cause (Chronic) Rejects
FAILURE MODE ROOT CAUSE NOT IDENTIFIED.* NO IMMEDIATE FIX / CORRECTION. USE PROBLEM SOLVING METHODOLOGIES (RED X / 6 SIGMA) REACTION BASED ON CONTROL LIMITS (STATISTICALLY CALCULATED) np chart
np
15
LCLnp
10
np-bar
5
UCLnp
0 0
10
20
30
40
Lot number
DEFECTS SEGREGATION PROCESS VERIFICATION • Or many sources or causes ( i.e. technology STOP and Contain inherent defects or defects caused by many sources of a root cause such as contamination/foreign material.) No known immediate fix is available to eliminate root cause of defect. Revised September 11, 2006
S F S
FIX START
28
FTQ
FTQ Improvement Process
Implement Alarm Reaction Plan if Limit Exceeded Reaction Plan: Yes
Alarm Limit Exceeded? Contain Investigate
Containment Plan
Implement Containment Plan Until Problem Fixed Revised September 11, 2006
29
FTQ
FTQ Improvement Process
Record Data Data must be recorded and plotted over time: At the cell level, the number of pieces rejected shall be recorded by defect category at a defined frequency. This data must be used to react to abnormal process conditions (process monitoring) Since the area of opportunity varies from sample to sample, the reject count must be converted into a rate (FTQ PPM) prior to charting Each area should have a performance tracking board that would reflect the manufacturing FTQ information by shift Revised September 11, 2006
30
FTQ
FTQ Improvement Process
Analyze Data
The basic quality tools are: Flow Charting Check Sheets Pareto Cause and Effect Run Chart Histogram Scatter Diagram Control Chart
Revised September 11, 2006
31
FTQ
First Time Quality Process
Initiate Structured Problem Solving Understand Defects and Decide the Order of Priority:
Problems 4
1
2
3
3
2
2
2
1
1
1
1
A B C D
Assign problems to Cross-Functional Group: 1
Select and Plan the Improvement: 1
2
Right Information 2
2
1
Responsible Team Works Problems
Right Cause 3 Right Timing
DEFECT 1. ---------------------2. ---------------------3. ----------------------
Fix the Biggest Problems First: Revised September 11, 2006
32
FTQ
FTQ Improvement Process
Analyze Data
Problem Identification
Flowchart Brainstorming
Problem Analysis
Pareto Chart Cause & Effect Control Chart Check Sheet Run Chart Stratification
Histogram Scatter Diagram Process Capability
Charts can be used for different purposes in various stages of the problem-solving process The tools included in the intersecting portion of this diagram can be used in both the problem identification and problem analysis phase of problem solving Revised September 11, 2006
33
FTQ
Histogram FTQ Tools
A histogram is a specialized type of bar chart. Individual data points are grouped together in classes, so that you can get an idea of how frequently data in each class occur in the data set. High bars indicate more points in a class, and low bars indicate fewer points Revised September 11, 2006
34
FTQ
Pareto FTQ Chart Tools
Pareto charts are used to display the Pareto principle in action, arranging data so that the few vital factors that are causing most of the problems reveal themselves. Concentrating improvement efforts on these few will have a greater impact and be more cost-effective than undirected efforts.
Revised September 11, 2006
35
FTQ
FTQDiagram Tools Scatter
Scatter Plots (also called scatter diagrams) are used to investigate the possible relationship between two variables that both relate to the same "event." A straight line of best fit (using the least squares method) is often included.
Revised September 11, 2006
36
FTQ
Control Charts FTQ Tools
The point of making control charts is to look at variation, seeking special causes and tracking common causes.
Revised September 11, 2006
37
FTQ
Flow Charting FTQ Tools
Flowcharts are maps or graphical representations of a process. They are particularly useful for displaying how a process currently functions or could ideally function. Flowcharts can help you see whether the steps of a process are logical, uncover problems or miscommunications, define the boundaries of a process, and develop a common base of knowledge about a process. Flowcharting a process often brings to light redundancies, delays, dead ends, and indirect paths that would otherwise remain unnoticed or ignored.
Revised September 11, 2006
38
FTQ
Check FTQSheets Tools
Check sheets are employed to compliance and ensure specific events are completed in the timing and sequence required.
Revised September 11, 2006
39
FTQ
Cause Effect FTQ&Tools
The cause and effect diagram is used to explore all the potential or real causes (or inputs) that result in a single effect (or output). Causes are arranged according to their level of importance or detail, resulting in a depiction of relationships and hierarchy of events. This can help you search for root causes, identify areas where there may be problems, and compare the relative importance of different causes.
Example Cause & Effect Diagram (Fishbone)
Revised September 11, 2006
40
FTQ
Run Charts FTQ Tools
Run charts (often known as line graphs outside the quality management field) display process performance over time. Upward and downward trends, cycles, and large aberrations may be spotted and investigated further. In a run chart, events, shown on the y axis, are graphed against a time period on the x axis.
Revised September 11, 2006
41
First Time Quality Manager Audit Checklist Example
FTQ
FIRST TIME QUALITY AUDIT CHECKLIST
Supplier:
Date:
Location:
Duns:
Part No./Description:
Auditor/Title:
Yes
A.) Define Reaction Plan & Alarm Limits.
No
Comments:
1. Are the alarm limits established based on current process rejects data? 2. Are the alarm limits communicated to operators? 3. Is the reaction plan established by defect? 4. Has the P the FTQ information for Chronic Rejects, KPCs and QCIs? B.) Identify and Count Rejected Parts. . Does the operator have sufficient tools and skills in order to 1.
Yes
Comments:
No
Comments:
Yes
No
Comments:
Yes
No
Comments:
Yes
No
Comments:
identify product discrpancys? 2. Are rejected parts removed from cell station on the established frequency basis?
m a Yes
C.) Record Data 1. Is the FTQ trend chart in PPM ‘s by cell and shift?
x E
e l p No
2. Is the FTQ “Tri Chart” or “Gate Chart” used as standards to record the data?
D.) Implement Alarm Reaction Plan if Limit Exceeded. (Max- Min) 1. Is there an evidence of reaction plan implementation? E.) Select Plan Improvement and Implementation?
1. Is there an evidence of an improvement plan developed? 2. Are corrective actions been implemented? F.) Evaluate 1. Was the record data up-dated to reflect the corrective actions effect? 2. If corrective actions were effective new alarm limits were established?
Revised September 11, 2006
42
FTQ
Additional tools to Facilitate FTQ Improvement
Quality Tools Statistical Engineering to develop solutions 6 Sigma Shainin
Lean Tools Value Stream Mapping Workplace Organization Error Proofing
Revised September 11, 2006
43
FTQ
FTQ Improvement Process
Select and Plan Improvement After FTQ problems have been identified through data analysis, improvement plans must be developed A recommended template has been provided to track implementation status of corrective actions (FTQ Tracker or Step Down Chart) To be make problem solving truly effective, standard work must be utilized. Standard work is like a recipe: varying method and content will not yield same results!
Revised September 11, 2006
44
FTQ
FTQ Improvement Process
Implement and Evaluate Once the Corrective Action has been implemented, the data must be evaluated for trends or shifts Did the problem stay “killed?” Can you turn the problem on and off? If so, change alarm limits and update the documentation This is one of the reasons it is so important to collect data over time Without data there is no way to evaluate the impact of the corrective action on the process If no significant reduction in FTQ PPM is observed, then it is possible the cause was misidentified Revised September 11, 2006
45
FTQ
5 Step Site Evaluation Plan
1 Understand the Value Stream
1. Walk the Value Stream and OBSERVE (5S, standardization, training, metrics, etc.)
2 Pareto Customer Issues
2. Does standardization exist in facility?
1. Pareto customer issues by systemic root causes from past (6-12 mo) of Problem Cases - Input for improvement priorities
3. Review using PFD or Current State Value Stream Maps as needed. Identify Kaizen opportunities.
2. What systems are in place to identify and improve the top issues daily, weekly, and/or monthly?
3 Review Internal Issues
1. Review pareto of internal issues from past 6-12 mo (FTQ, scrap, rejects, audits) 2. What systems are in place to identify and improve the top issues daily, weekly, and/or monthly?
4 Review Other Improvement Activities
1. What other continual Improvement Activities are in progress? 2. How were the activities selected? 3. How is the effectiveness of the activities measured?
Revised September 11, 2006
5 FTQ Process
1. Implement FTQ Improvement Process 2. Prioritize, assign resp., and set target dates for action items 3. Use A3 format to document the plan
46
FTQ
5 Step Site Evaluation Plan
Example: Customer Issues Problem Case Problem Descriptions (Jan03 - Mar03) 7 6 5 4 3 2
(1 ) 1 0 O th e rs
P a rts n o t d is p e n s in g
C o re w id th in c o rre c t
W ro n g b a rc o d e p rin te d
W ro n g c o p y
S m e a re d g ra p h ic s
B a rc o d e n o t re a d in g
C o v is in t la te re s p o n s e
W ound w ro n g
L a te S h ip m e n t
0
W ro n g in fo o n c a rto n la b e l
1
Proble m Case Root Cause s - Syste mic Issue s (Jan03-Mar03)
16
12
8
4
0 Lack of standardized instructions (press setup; f inishing)
No formal system Lack of standard Inadequate fin to manage process f or goods inv levels; customer issues containment No re-order points
Poor Mtrl ID
No PPAP submittal tracking system
Lack of understanding customer ship requirements (Overship)
Revised September 11, 2006
Transmission system f ailure; No system to assure functionality
APQP failure; No system to ctrl Print revisions requirements not f ully review ed
47
FTQ
5 Step Site Evaluation Plan
Example: First Time Quality (internal) First Time Quality - July 2003 62, 849 PPM 25000
PPM
20000 15000 10000
Die Cut
W rink les
Hous ek eeping / 5S
Regis tration
S tic k y
P roc es s / S etup
0
Ink / P rint Q uallity
5000
Next steps: 1. Determine root cause / systemic issue 2. Pareto 3. Attack top 70~80%
FTQ Per Press # (July 2003) 20000 18000 16000
PPM
14000 12000 10000 8000 6000 4000 2000 0 6
1
8
3
NR
7
2
4
5
Press #
Revised September 11, 2006
48
FTQ
FTQ Improvement Process
Institutionalize Lessons Learned and Look Across Lessons Learned must be incorporated into all existing documentation. Then Look Across to ensure implementation in all applicable processes, products. DFMEA’s Process Flow Diagram PFMEA’s Process Control Plans Process Routings Operating Instructions Employee Instructions Product Drawings Tool Drawings Total Productive Maintenance (T.P.M.) Boundary Samples
Revised September 11, 2006
49
FTQ
Alarm Limit Calculation using np Chart- Class Exercise
Class Exercise (notes contain details)
Revised September 11, 2006
50
FTQ
First Time Quality
How is First Time Quality calculated?
Tally Sheet
An example at the cell level: Cell “A” has six operations
1
2
3
4
5
28
6 16
Reject data is collected at operations 3 and 6. Cell “A” produced 1040 good pieces during the first hour. At OP.3, 28 pcs. were rejected. At OP.6, 16 pcs. were rejected. What is the FTQ in PPM for Cell A? 28 + 16 44 1040 + 28 + 16 =1084 X 1,000,000 = 40,590 PPM FTQ Revised September 11, 2006
51
Alarm Limit Calculation using np Chart- Class Exercise
FTQ
NP Charting for FTQ
25
Defects Pareto
100 90
20
80
Nonconforming
UCL=
70
15
60
avg=
10
50 40 30
LCL=
5
20 10
0
0
1 2 3 4 5 6 7 8 9 10 11 12 13 14 15 16 17 18 19 20 21 22 23 24 25 Subgroups ( Days) Hours or Days Non-conforming 18 Sample Size (Avg) Defects wing mark wing / body fold wrong paint dot paint location wrong or no clip Total nonconforming: Production PPM Defective np
1 8
2 10
3 9
4 11
5 9
2 3 2
1 2 2 3 2 10 18
5 1 1
4 2 5
2 5 1
11 18
1 9 20
1 8 18
2 9 19
np1+np2+…..npk
n = avg sampleksize (18)
6 8
1 2 4 1 8 18
7 6
8 8
9 7
10 11
11 12
12 11
13 13
14 18
15 17
16 12
17 9
18 10
1 2
3 2
4 2
2 5 3
1 3 4
3 4 3 3
2 1 6 2 6 17 17
1 4
2 5
3 8 18
1 5 3 7 2 18 18
1 2 8
2 1 6 17
2 2 5 2 1 12 18
2 2 9 18
2 1 10 19
1 7 18
1 11 19
3 11 19
13 19
1 12 18
19 7
20 8
21 5
6 1
7 1
1 3
7 18
8 20
1 5 18
22 9
23 11
24 8
25 7
1 1 1 2 4 9 18
1 2 4 4
2 3
1 3 3
3 8 18
7 19
11 20
where np= number nonconformin, k= subgroups
Reference Attribute Data, AIAG SPC Manual, page 111
np
"=SUM(C3:AA3)/25" np = number nonconforming
k = subgroups (25)
UCLnp __ UCLnp =
0
LCLnp =
0
np = np1+np2+…..npk k LCLnp
UCL=np + 3* = 0 =
0
LCL=np - 3* Revised September 11, 2006
(np(1-np/n)) (np(1-np/n))
52
FTQ Tools
FTQ
FTQ - Performance Tracking 2004 CY FTQ Performance
FTQ
10000 9000 8000 7000 6000 5000 4000 3000 2000 1000 0
Projection
2003 Dec Final Jan Feb Mar Apr May Jun Jul Aug Sep Oct Nov Dec 1 2 3 4 5 6 7 8 9 10 11 12 13 14 15 16 17 18 19 20
FTQ Value (PPM)
Goal
Monthly Values
Daily Values
2004 CY FTQ Performance Data
FTQ Projection Goal
2003 Dec Final Jan Feb Mar Apr 9000 8000 7000 6000 8000 6500 6000 4500 4500 4500
May 5000 5500 4500
Revised September 11, 2006
Jun 4000 5000 4500
Jul 3000 4500 4500
Aug 3000 4500 4500
3000 4000 4500
54
FTQ
FTQ - Performance Tracking
FTQ In this row put in actual monthly values for FTQ PPM. Chart below will automatically generate and will automatically show up in FTQ display format tab. You can print out the FTQ Display tab to post on you cell " Glass Wall"
FTQ Projection Goal
Year-End Final %: Put in 2003 month of December FTQ value in PPM here
2003 Dec Final Jan Feb Mar Apr May Jun Jul Aug 9000 8000 7000 6000 5000 4000 3000 3000 3000 8000 6500 6000 5500 5000 4500 4500 4000 4500 4500 4500 4500 4500 4500 4500 4500
Goal: Forecast Put in your Forecast by month here. Forecast line will automatically be plotted above.
Put in your year end goal. Corporate goal is a minimum of 50% from December month actual in previous year
Revised September 11, 2006
55
FTQ
FTQ - Top 5 Issues
800 325
120
Branch out of tolerance
Unseated Ternimals
400
Missing Components
575
Damaged Terminals
1000 800 600 400 200 0
Crossed Wires
PPM
FTQ Top 5 Pareto
Cell/Process
Top 5 Quality Defects Revised September 11, 2006
56
FTQ FTQ Tools – Step Down Chart FTQ IMPROVEMENT PROCESS - STEP DOWN CHART Supplier DUNs #
Supplier Name Oct-04
FTQ of Relevant Processes contributing to Delphi APR/WAR/ LP/ FTQ
Supplier
Nov-04
Dec-04
Metric
Start Past 6 Month Ave.
Actual
Target
PPM
5.80
4.7
5.0
10
15.0
(per month)
(monthly average)
Number of Defects
17
(per month)
(monthly average)
FTQ - Process 1
10300
(per month)
(monthly average)
FTQ - Process 4
9700
(per month)
(monthly average)
FTQ - Process 5
1400
(per month)
(monthly average)
FTQ - Process 6
14400
(per month)
(monthly average)
FTQ - Process 9
400
(per month)
(monthly average)
(per month)
(monthly average)
9500
Jan-05
Actual
Target
4.86
4.5
10
13.0
Actual
Target
3
4.0
7
10.0
Feb-05 Actual
Target
(per month)
Metric PPM CYTD
CS
36200
7.0
8500
6300 6600
7500
1100
1100
1300
6500 1200
1200
5500
12000
1000 8500
11000
900 7900
10000
700
320
400
9000 600
33400
33200
(monthly average)
Start Month Status
360
8000
Level 2
27100
25500
27220
24080
20940
Red / Green will indicate whether targets are met
Action Item List Color Code:
Level 1
Level 2
(number new i nitiated) (number of open)
Action item target dates met Action item target dates not met No actions items assigned for this month
Delphi Single Point SQE Name Phone Number
Delphi Purchasing Name Phone Number
Delphi SQ Champion Name Phone Number
240
30360
Current Month Status
6.0 Level 1
3.0
8300
280
FTQ - 5 Processes Total
Actual
7300 7300
900
Target
Apr-05
8.0
9500
2000
Actual
9300 9200
11400
Mar-05
3.5
10000 9500
9600
Kickoff Date
Supplier Name Phone Number
Revised September 11, 2006
57
FTQ
FTQ Tools
FTQ IMPROVEMENT PROCESS - ACTION PLAN
Target Dates
Action Items List Item
Resp
Plan
Impl.
Issue Identified
Action Plan Implemented
Action Plan Proposed
Issue Resolved
Actual Completion Dates Plan
Impl.
Comments
Process 1 Top Defect Action Items
Process 4 Top Defect Action items
Process 6 Top Defect Action items
Process 9 Top Defect Action items
Revised September 11, 2006
58
FTQ FTQ PPM by Issue Pending Actions to address Top 5 Issues Issue Problem Discription Crossed Wires 800 Damaged Terminals 575 Unseated Ternimals 400 Missing Components 325 Branch out of Tolerance 120 99 Issue 6 80 Issue 7 70 Issue 8
Action Plans to Address Top 5 Issues Corrective Action Planned Start Date
mments on each column noted above in red. Mouse over to see.
Target Date
Status
FTQ Impact
Owner(s)
= On track to meet target date = Off track to meet target date by < 1 month = No Plan or off track to meet target date >1 month These have to pasted into the cells in column H above manually. Revised September 11, 2006
59
FTQ
Wrap Up Quiz
Class participants complete FTQ Quiz(10 minutes)
Review Responses
Revised September 11, 2006
60
FTQ
FTQ Quiz Responses
First Time Quality (FTQ) is an improvement measurement of PPM reduction over time . We measure FTQ by counting the number of pieces rejected versus the total number of pieces attempted. If we don’t make good parts the first time, we have to inspect in quality. Inspection is only 85% effective at best. FTQ is a tool to facilitate our operational improvement in quality and cost. Inspection is like a filter, and will miss some defects. If we don’t fix our quality problems internally, we will never be able to fix our external customer issues. Number of pieces rejected /Total number of pieces attempted X 1,000,000 = FTQ PPM Revised September 11, 2006
61
FTQ
FTQ Quiz Responses
The most important step in containing the problem is the immediate action taken, which leads to the elimination of the problem. Non-chronic rejects require immediate reaction at the first occurrence. Chronic rejects are those whose failure mode root cause has not been identified or fixed. When alarm limit is exceeded, the reaction plan must be implemented, and we implement a containment plan until the problem is fixed. One example of a basic quality tool used to analyze data is a Pareto chart. The tool used to track implementation status of corrective action and improvement is the FTQ Tracker (or Step Down Chart). All existing documentation must be updated in order to institutionalize lessons learned. Revised September 11, 2006
62
FTQ
Closing Comments - FTQ Improvement Process
Implement Improvement Work the Action Plan Update plan as required Document improvements
Revised September 11, 2006
63
FTQ
Closing Comments - FTQ Improvement Process
Delphi’s Suppliers are responsible for their sub-tier suppliers: Roll the FTQ process out to sub-tier suppliers to help them gain the improvement benefits and to lower the probability of your company receiving nonconforming parts
Revised September 11, 2006
64
FTQ
FTQ Expectations & Key Points
FTQ is a Requirement: A FTQ Process, that Monitors & Controls at the point of build. Set FTQ Alarm Limits to “1” reject for all safety critical features. Set FTQ Alarm Limits to “1” reject for all non-chronic(special cause) failures Reaction Plans include extra containment to Protect the Customer. Customer notification evaluated by engineering on special cause events. FTQ Reduction through a Rolling Top 5 or equivalent process. Delphi Tier 1 suppliers ensure FTQ is correctly implemented Delphi Customer Specific Requirement 7.3.6.3: Product Approval Process, “The supplier is expected to develop and implement a FTQ process with appropriate alarms and reaction plans defined.” Goal is Zero Incidents, Zero Spills, Zero Defects to our Plants. Revised September 11, 2006
65
Related Documents 3m3m1z
Ftq Overview 2u2pz
April 2021 0
Ftq Overview 2u2pz
December 2019 35
Ftq 1m2j11
September 2021 0
Overview 3e4r5l
November 2022 0
Ss7 Overview 5d586q
October 2019 51
Nutricentials Overview 6h432y
March 2021 0More Documents from "mishoo73" 141h3w