V-graph Packaging Heineken 563n1q
This document was ed by and they confirmed that they have the permission to share it. If you are author or own the copyright of this book, please report to us by using this report form. Report 3b7i
Overview 3e4r5l
More details w3441
- Words: 31,364
- Pages: 89
I V-GRAPH
I I j
1-----------_ ___ MER
MACHINE CAPACITY
1
MACHINE
Heinekeri
WBBM Report Series 33 Delft University Press
Efficiency Analysis of Packaging Lines
libliotheek TU Delft
IIIII I IIII III III II IIIII I I1II IIII II C
OOQl113~32
2414 511
5
WBBM Report Series
WBBM Department of Mathematics and Computer Science Delft Universityof Technology Room ET 05.040 Mekelweg 4 2628 CD Delft , The Netherlands Phone +31 15 278 16 35 Fax +31 15 278 72 55
33
Efficiency Analysis of Packaging Lines
F.L. Härte
Delft University Press, 1997
The WBBM Report Series is published by: Delft University Press Mekelweg 4 2628 CD Delft, The Netherlands Phone +31 15 278 32 54 Fax +31 15 278 16 61
Editors: Roger M. Cooke Hans van Maaren Michiel A. Odijk Department of Mathematics and Computer Science Delft University of Technology
CIP-GEGEVENS KONINKLIJKE BIBLIOTHEEK DEN HAAG Härte, F.L. Efficiency Analysis of Packaging Lines / F.L. Härte - Delft: Delft University Press. - Ill. - (WBBM Report Series 33) ISBN 90-407-1459-2 NUG! 841 Trefw.: Empirical model building, Performance analysis, Product ion lines Copyright @1997 by WBBM, Delft University of Technology No part of this book may be reproduced in any form by print, photoprint, microfilm or any other means, without written permission from the publisher: Delft University Press, Mekelweg 4, 2628 CD Delft, The Netherlands.
CONTENTS CHAPTER
1
1
INTRODUCTION
1. 1 Heineken Zoeterwoude . . 1.2 Problem definition .. 1.3 Research definition IA Efficiency analysis .. 1.5 Report outline ...
CHAPTER
..1
. .... 1 ...... ............. ..... 2 ..... 2 . .. ..... ... .. . ..... 3
5
2 PACKAGING LINES
2.1 Machinery .... ....... ..... ...... ...
... .... ........ ....... ..... ... ... ..... ...............5 .. .. .... ... .......... ..... 5
2.1.1 Boltlc fitting line 2.1.2 Can fitting line .... . .. .................... .
. .. ... ... .. ... ... . . .... 6
2.2 Bringing the machinery together ........... .... ... ............. . 2.2. 1 Design principle and buffer st ratcgy
CHAPTER
3
DEFINITIONS
3. I Efficiency ............... . 3. 2 Line parameters ................ . 3.3 Machine parameters ....... . . . . 3.3. 1 Machine states ............. ......... .... . 3.3.2 Machine failurc behaviour 3.3.3 Machine efficiency .. 3.3. 4 Machine production rates ...
3A Buffer parameters .. 3.4. 1 Dynamic accumulation 3.4.2 Statie accumulation ...
3.5 Setting the line parameters
CHAPTER 4 DATA 4 . 1 Registration 4. l.l Statie data 4. 1.2 Dynamic data .. .
.. ...... .. ... ..... .
..9 . .. ..... ..... .. ......... ..... ..... .. ...... 9
11 ..... 11 ... ..... 13 ..... .. 14 . ... .. 14 ..... 15 ..15 . .. 16
... 17 ..... ... ... 17 . ... ...... 23
...... 24
25 ...... 25 .. .. ....... 25 . .. 26
4.2 Database ... ....... . . 4.3 Visualisation .. . 4A Line parameter estimation 4.5 Machine parameters ............. .
. .. 27 ...... 27 .. 27 . ..... 27
4.5.1 Machine state .. 4.5.2 Machine failure behaviour 4.5.3 Machine efficiency .. 4.5.4 Machine production rate .
.... 27 ..28 .... ... .29 . .. 29
4.6 Buffer parameters ................. .. ...... 4.7 Organisational aspects .. ... . .. ..... ..... .
. .. .30 .... 31
CHAPTER
5
33
ANALYSIS
.. ... ............... .. ... .. ... ... 33 5.1 Efficiency limits and buffer strategy performance . . ...... .. .. .. .. ..... ......... 36 5.2 Machine event summary and Machine efficiency analysis .. 5.3 Accumulation ratelRecovery rate and Buffer efficiency analysis ..... ... .. ... .. ...... ..... ....... 38 54 V-graph analysis .............. ..................... ............. .... ......... ... ....... .. .. .. 43 5.5 Statistical analysis : Histograms ... ....... ..... ..... 47 5.6 Event list and Event patterns ... ........ .... .. .. .. .... ... .... .... .... .. ........ ..... ... .. ... .. ...... 48 5.7 Efficiency Loss Allocation algorithm.. .. ...... .. ...... ... ... .... .. .. .. ..... ................ 50
CHAPTER
57
6 SIMULATION
... ............ ... ..... 57 . .. ..... ....... ..... ...... 59
6.1 Mathematical models 6.2 Packaging line modeis ...... . 6.2. 1 Analytical models 6.2.2 Simulalion models .......... ................... . 6.2.3 Simulalion modelling proccss 6.2.4 Packaging line simulalion lISC
.. ..... ...... .... ..................... ..... .. .. ............... 59 . .. ... ....... ... .. .. .. ........ 59 ................... ....... .. ..... 61 .......... .............................. 62
CHAPTER
7 RESUL TS
63
CHAPTER
8 CONCLUSION S
65
REFERENCES
.... ...... .... .. ... .. ... ..... ... ............. ....... .... ....... ... .... ...... ... ... .......... ... .. .. ..... ...... ... ..... 67
SUMMARY
.. ... .. .. .. .. ... .. .. ..... ..... ..
SAMENV A'ITING
. ... .. .. .... .. ... ..... .. ...... .... ... .. ..... .... .... .... .... .. .. ..... ...... 69 .... .70
ApPENDIX A: LINE LOGIC .............................. .................................................. 71 ApPENDIX B: BASIS REGISTRATION ................................................................. 73 ApPENDIX
C: SIMULATION USING UNICORN .................................................... 75
Cl Unicorn .............. ......... .. .. ..... .... ......... .. ..... ..... ... .. ... ... ... ..... ... ... .. .... .... .. .. .. ... .. ... . ..... 75 .... .75 C2 Mathematical model .... .78 C3 Example ........................ .
ACKNOWLEDGEMENTS This report is the conclusion of my final project of the two-year post MSc program on management engineering called 'Wiskundige Beheers- en BeleidsModellen' from the Statistics, Stochastics and Operations Research Unit of the Department of Mathematics and Computer Science ofthe Delft University of Technology. During the second year of this course, I worked on the topic of process registration and efficiency analysis of packaging lines at the Heineken Brewery in Zoeterwoude. My tasks were mainly concentrated around two projects: the VP-IN project (VerPakken INformatisering) for the co-ordination of the information technology activities in the packaging department and the ' 2 good 2 bee true ' project for the improvement ofpackaging line 2. The examination board was formed by prof dr. RM. Cooke (Delft University of Technology), dr. ir. LE. Meester (Delft University of Technology), ir. AC. Bosma (Hein eken Technical Services), ing. Al. van den Broek (Heineken Nederland), and ir. GP.E. Vos (SCULPO/Sch) . At Heineken I would like to thank Atze Bosma, Gijs Vos and Menno Antal for their guidance and help, and for making my project at Heineken a true leaming experience. Also I would like to thank Arjan van den Broek for his enthusiasm and our 'co-oPOOHration'. In addition, I would like to thank my ot her colleagues at Heineken, and Vincent Schakel and John van den IJssel from TH Rijswijk At Delft University of Technology I would like to thank Roger Cooke for his help and his interest in this project and my colJeagues, especially Nicole van EIst, Jaap Karelse and Bemd Kraan for all of our collective activities, all 'strictly business ' of course.
Frank L Härte March 1997
CHAPTER
1
INTRODUCTION
This chapter briejly describes (he packaging department of the Heineken Brewery in Zoeterwoude. The problem definition and research definition are discussed Also the idea of efficiency analysis is explained and (he outline of this report is given.
1.1
Heineken Zoeterwoude
The Heineken Brewery in Zoeterwoude has a yearly capacity of around 8 million hectolitres of beer. At the packaging department this beer is put into beer containers on 7 packaging lines, which package beer in boules, cans (or kegs), put the boules or cans in crates, trays or cart ons, and then on pallets. A packaging line is a sequence of high-speed machines. Each machine performs a task of the packaging process. The machines are connected by conveyors which also serve as buffers. The efficiency of a packaging line is the percentage of the actual number of fi.lled beer containers versus the possible number of filled beer containers, for a given period of time. The efficiency of most packaging lines is (too) low because of the occurrence of various machine failures. The average line efficiency is between 60% and 90%. The total production costs of beer consist mainly of packaging costs. The research project of this report concentrated on packaging line 2, which was installed in the spring of 1996 and is divided in two so-called streets, that can both pro duce 40.000 boUles per hour. On line 2 four different types of boules are filled with several types of beer for the export markets. Production continues almost seven days per week and 24 hours per day. Each day consists of three shifts of 8 hours and every shift the line is run by a team of operators. It is a high-tech line with modern machinery, using information technology.
1.2
Problem definition
In order to design and improve packaging lines, it is necessary to have some means of predicting and explaining their performance and identifying the influence of the key line parameters (e.g. machine capacities, failure behaviour, conveyor speed, buffer capacities, etc.). Traditionally packaging line practice relied on extrapolation of past experience or on the use of simple rules of thumb . The recent developments in information technology within the packaging process enable the use of analysis methods to assess the efficiency of packaging lines. For the design of packaging lines these methods can help to avoid that the line fails to perform as originally expected, after it has been installed. For already installed packaging these methods can help to identify the sources ofloss of productivity. The design of new packaging lines is likely to be based on (successful) existing packaging lines, therefore the efficiency analysis of installed lines does not only serve to improve the efficiency of existing lines but also the design of new lines. Improving the efficiency of packaging lines leads to lower packaging costs per unit by either increased output or lower personnel costs and/or lower equipment and material costs. It also improves the delivery reliability. Knowing the effect of the line parameters on the efficiency can help in making cost/benefit analysis of packaging lines. Finally, an awareness of the effect of the line parameters on the efficiency might influence the production practice.
1.3
Research definition
The research underlying this report concerns the efficiency analysis of packaging lines. The goals of this research were to increase the knowledge of and insight into packaging lines, to explain the efficiency of packaging lines, and to help improve the efficiency of packaging lines. This is achieved by creating a framework for efficiency analysis of packaging lines using mathematics and information technology. The analysis methods can be applied on both process data of existing lines as weil as in simulation studies. Note that efficiency analysis can only detect the ' symptoms', the analysis results have to be interpreted to arrive at a ' diagnosis' and a possible 'cure' or corrective measures to improve the efficiency (figure 1).
MEASURES
Efficiency Analysis: INT ERPRETATION
DATAGATH ERING
DATA REPRESENTATION
rlgure 1:
1.4
~lficiency
analysis alld improvemellt cycle
Efficiency analysis
Efficiency analysis of a packaging line (newor installed) is the actlvlty of gathering the appropriate data, representing these data in a comprehensible manner, caJculating the relevant performance indicators and interpreting these figures . The main goal is to understand or explain the (loss ot) production. Often this will lead to corrective measures on the packaging line and about the effectiveness of these measures. The efficiency analysis of a packaging line should be a multi-disciplinary activity of the data analyst, the technical manager/mechanics or the designer, the quality manager, the production manager and operators, and the ofthe packaging line. The data analyst is responsible for the data gathering. The raw data is collected (in a database) manually and/or automatically from the line monitor system. The data analyst corrects these data for errors and noise, and filters out irrelevant data. For existing packaging lines the operators supply data either by writing events on a list or by pushing buttons on the line monitor system, the production manager provides the production schedules (including stops and change-over), and the gives information about all costs. For new packaging lines data from comparable existing lines can be used or data can be generated by simulation; a sensitivity analysis ofthe efficiency analysis for these data can be performed. The data analyst transforms the edited data into information by combining these data and th en constructing comprehensible graphs and calculating performance indicators. It is his/her job to translate questions on the packaging line into the correct corresponding queries. This will normally lead to a number of standard reports created each time period (shift, week, etc.). These reports should ideally focus on different aspects and together give a complete view. The database should be flexible, meaning that ad hoc queries can easily be made. 2
The technical manager or designer, quality manager and production manager or operators interpret these (standard) reports (possibly helped by an interpretation ofthe data analyst) and, if necessary, ask for more information or take corrective measures. The gives the interpretations a ftnancial dimension, allowing cost-beneftt analyses. On existing packaging lines the operators should also be informed on their working areas. The interpretation is based on norm values (determined by the objective and history of the packaging line), historical comparison and comparison among packaging lines. The data should be analysed over different production shift teams, different time periods, different product types, and different packaging lines . By creating standard and gene rally applicable methods, the efficiency analysis of packaging lines is made easier, more familiar and comparable. This report mainly focuses on the tasks of the data analyst. Other aspects like technical, quality, and human aspects are not taken into consideration here, but obviously play a important role in interpreting and improving the performance of packaging lines. The aim of this report is to create a framework for efficiency analysis of packaging lines using mathematical methods. Throughout this report a general view is taken, i.e. all methods can be applied on an arbitrary packaging line. Most examples however apply to packaging line 2 of Heineken Zoeterwoude, although no real data is revealed in this report.
1.5
Report outline
This report presents a framework for the efficiency analysis of packaging lines. In chapter 2 the packaging process and the design principle of packaging lines are described. Then chapter 3 defines the efficiency of a packaging line, and lists the line parameters that influence the line efficiency. These line parameters are formed by the machine and buffer parameters. In chapter 4 the data acquisition process is discussed . Chapter 5 introduces various mathematical methods for efficiency analysis, consisting of graphs and performance indicators. For each method a description is given, the objective and use of the method are presented, the required data are defined, the calculations of the method are explained, and an example is given. Chapter 6 compares analytical and simulation modeis, and discusses the possibilities of using simulation to analyse the efficiency of packaging lines. Results are listed in chapter 7. Finally, in chapter 8 some conc1usions and recommendations are presented The appendices describe the line logic, basis registration and an example of a simple simulation model.
3
CHAPTER
2
P ACKAGING LINES
In this chapter the packaging process and the equipment of a packagillg /ine are described and the design principle ofpackaging fines is discussed. A packaging line is defined as 'the aggregate of distinct machines working together in a sequence to fill beverage containers (botties, cans, or kegs *), including the preceding and succeeding machines and equipment; usually from the input of packaged and mostly palletised empty goods until the output ofpackaged and palletised full goods' [lOl In other words: a packaging line is a series system of the stages of the packaging process. For each stage one or more (parallel) machines are used. These machines frequently have to deal with failures. The machines are put in a sequence and connected by conveyors, which can also serve as buffers. There are many different types of packaging lines, all having their own design characteristÎcs. Some lines are designed for short and flexible production runs (i.e. they can handle different product sizes and product packages), other lines are designed for mass production (i.e. they are dedicated to just one product). Some lines have many parallel machines and/or large buffers, ot her lines are strictly series and/or have small buffers. Also, designs have to meet space and capital constraints. However, most bottle and can filling lines have similar machinery for the different stages and follow a similar design rule for bringing the machinery together. For aspecific packaging line decisions are made regarding the individual machines, conveyors and other line equipment. The selected equipment is configured in the line layout and the controls are chosen. Each of these factors affects the overall design of the line, and thus the performance of the line. It is important to keep the objective and history of a packaging line in mind when the its performance is being analysed, because the inherent limitations ofthe line determine the maximum line efficiency.
2.1
~achinery
The packaging process starts with the input of empty bottles or canst . Then these bottles or cans are washed or rinsed, filled with beer, closed, pasteurised, and labelled (botties only). Finally the bottles or cans are put into their final packaging (boxes, six-packs, etc.) and gathered on pallets. At several points on the packaging line inspection machines are used. The function ofthe most important machines ofbottle and can filling lines are described below. 2.1.1 Bottle filliog lioe Basically, there are two types of bottle filling lines: bottle filling lines for one-way bottles and bottIe filling lines for returnabie bottles. Some filling lines can handle both types of bottles and are called multi-purpose lines.
Keg filling line are not considered in this report, but can be approached in a similar way. The main flow of a packaging line is fornled by the beer: unpackaged beer is the input and packaged beer is the output. In this view, the flow of empty bottles before the filler can be considered as coming from the 'glass streel' (similar to the carton street at the packing machine). t
5
One-way bottle filling fine For non-retumable or so-called one-way bottles, there are several packaging options: carton boxes with six-packs, or with an interior partition, trays, etc. One-way bottIe filling lines produce mainly for export. Packaging line 2 is an example of a non-retumable-bottle filling line. Figure 2 shows the layout ofline 2 and describes its most important machines. First, pallets with new bottles are placed on the line. The protective foil is removed from the pallet by the defoil machine and the bottles are removed from the pallets by the depalletiser. The bottles are transported to the rinse machine by a bottIe conveyor. There the bottles are rinsed with water, and go on to the filling machine. At the filling machine the bottles are filled with beer, closed with a crown and then moved to the pasteuriser. The pasteuriser pasteurises the full bottles to make the beer keep longer. Then the bottles are transported to the labelling machine, which applies the labels onto the bottles. Next the bottles are transported to the packing machine where they are put into the final packaging. The packing machine is supplied with the packaging material by the carton street. This is a series of machines that unfold and glue cart on boxes, trays, interiors, six-packs and combine these into the final packaging. The full cart ons/trays are transported by a case/tray conveyor to the palletiser, which gathers the case/trays on pallets. A protective foil is applied around the full pallets and finally the pallets are taken from the line and dispatched to the warehouse. Returnable-bottle filling fine Usually retumable bottles are filled and packed in crates. Retumable bottle filling lines pro duce mainly for the domestic market. First, pallets with crates of empty retumed bottles are placed on the line. The crates are taken from the pallets by the depalletiser and the botties are taken out of the crates by the decrate machine; the bottles are transported to the bottle washing machine by a bottie conveyor, and the crates are transported to crate washing machine by a crate conveyor. There the crates and bottles are washed. The bottles go on to the filling machine and the crates go to the crate store. At the filling machine the bottles are filled with beer, closed with a crown and then moved to the pasteuriser. The pasteuriser pasteurises the full bottles to make the beer keep longer. Then the bottles are transported to label machine, which applies the labels onto the bottles. Next the bottles are transported to the recrater, where they are put back into the crates from the crate store. The full crates are transported by a crate conveyor to the palletiser, which gathers the crates on pallets. Finally the pallets are taken from the line and dispatched to the warehouse.
2.1.2 Cao filIiog lioe For cans, there are also several packaging options: carton boxes, six-packs, trays, etc. First, pallets with empty cans are placed on the line. The cans are removed from the pallets by the depalletiser and transported to the rinse machine by a can conveyor. There the cans are rinsed with water, the cans go on to the filling machine. At the filling machine the cans are filled with beer, closed with a lid and then moved to the pasteuriser. The pasteuriser pasteurises the full cans to make the beer keep longer. Next the cans are coded by the laser code machine, inspected and transported to the packing machine, where they are put into the final packaging. The cans are often collated using some shrink-wrap material. The full cartons/trays are transported by a case/tray conveyor to the palletiser, which gathers the cases/trays on pallets. A protective foil is applied around the full pallets and finally the pallets are taken from the line and dispatched to the warehouse. 6
Bulk glass defoil machine Pallets with empty new bottles are supplied [rom the warehouse. The defoil machine removes the foil that protects these pallets. The pallets are transporlcd to the depalletiser. Bulk glass depalletiser The depalletiser removes the empty bottles from tlle pallets layer by layer onto a conveyor to the rinse machine. Rinse machine The rinse machine (or rinser) rinses the bottles with water or air before filling. Fi/ling machine The filling machine (or filler) puts the beer into lhe empty boUles and closes the bottIe with a crown. The bottles are transported to tlJe tunnel pasteuriser. Before filling the bottles are inspected for being empty; after tlJe fill process the bottles are inspected for being filled correctiy. Bottles that do not these inspections are removed from the line. Pasteuriser In the tunnel pasteuriser the bottles are pasleurised for 45-60 minutes 10 make the beer keep longer (product stability). The bottles are transported 10 the labelling machine. Labelling machine The labelling machine (or labelIer) applies labels on filled bottles: front label, back label, neck label and/or wraparound. Again lhe boules are inspected and, if necessary, removed from the line. The bottles are transported to lhe packing machine. Packing machine The packing machine puts the filled bottles in lhe final packaging. The packaging is supplied by a so-called carton sIreeI, a series of machine lhal erecl boxcs, unfold six-packs and interiors etc. The full cartons/trays are closed, weighted for inspection, coded and lhen lransported 10 the palletiser. Palleliser The palletiser puts the carton/trays with ful! boUles on the pallels. The pallets are transported to the shrink-foil installation. Shrink-foil insta/lalion The shrink-foil inslallation shrinks a proleclive foil around lhe full pallels. The pallels are then dispatched to lhe warehouse. Bottle conveyors Bottle conveyors transport the boUles from one machine to the other and consists of segments of chains. Most conveyor also servc as buffers, because of some extra chains. Case conveyors Case conveyors transport cartons or trays from one machine 10 the olher. The buffer function of these conveyors is created by the distance between the cases.
Figure 2A: Machine description ofpackaging fine 2 7
Boxes
Shrinkjoil Installation
lnteriors
Six-packs
Palletiser
Packing machine
Pasteuriser
Labellillg machine
Figure 2B: Layout ofpackaging fine 2
8
2.2
Bringing the machinery together
Historically the filling machine has been the most important machine, because the filling machine is the most quality critical element of the line and because the filling machine performs the primary function of the packaging line, actually putting the product into the container. Therefore, on most packaging Iines the filling machine' is cal led the ('ur{' lI1uchil1{, and the rest of the hne is designed around it [15]. Usually the line efficiency is based on the capacity ofthe filling machine and other equipment is sized to ensure, as far as possible, that the filler does not stop because of failures on the other equipment. This is done tor both efficiency and quahty reasons.
2.2.1
Design principle and buffer strategy
The design principle for packaging Iines amounts to a hut/à slmle}!,y, which mak es sure that the buffers before the core machine are almost full and the buffers after the core machine are partly empty. This allows the core machine to continue in the case of a failure somewhere else on the hne. In other words the core machine shou ld have produets at the infeed and space at the discharge.
Hut/à sImIe}!,)' This buffer strateb'Y consists of two complementary elements. The first element is formed by the buffers which provide accumulation. Statie accumulation is achieved by putting a real buffer between machines (e.g. an accumulation table or a crate store J. Dynamic accumulation is accomplished by the conveyors bet ween the machines. t\ilachil1~
,_ _ _ _ _ _ _ _ _ _ _ _ _ _ _ _ _ _ _ _ _ _ _ _-,
CO/JOC;I.' ,
160'';(, 140%
100%
Machin~
60%
~
'"
.<: U Ol
E
.~
]
~ 0
Cl
~ L:
-.:
~
'" cr:
01)
~
'§
* Ol
0...
::
" .D Ol
....l
on
c:
~
~
.~
u
]
0...
0...
Ol
~
~
-"c:
~
Sometimes the pasteuriser is taken as the core machine. In the tuture o ne of the other machines may become dominant (for instance the packing machine becau se of the growing diversit y of packaging options and promotional packaging). Or the V-shape may even become (more) flat , as the reliability ofthe machines improves, making buftèrs obsolete
9
The second element is formed by production speeds of the machines. The machines on either side of the core machine have extra capacity or overcapacity. This overcapacity ensures that the core machine has products at the infeed and space at the discharge. This enables these machines to catch up after a failure has occurred. After a machine has had a failure and (a part of) the accumulation is used, then the overcapacity ofthe machine is used to restore the system back to the situation before the failure. The machine before and after the core machine have extra capacity with respect to the core machine. The machines upstream of the core machine each have extra capacity with respect to the next machine, and the machines downstream of the core machine each have extra capacity with respect to the previous machine. This results in the 'V' -shaped capacity graph for the line stages, with the filling machine at the lowest point. Figure 3 shows the machine capacity graph (or V-graph) of a typical non-returnable bottle filling line. V-graph The V -graph plays a central role in the buffer strategy of a packaging line. Essentially the Vgraph of a packaging line is a graph of the machine (group) capacities in the sequence of the packaging line. In keeping with the packaging line design principle the machines on either side of the core machine have extra capacity. This resuIts in the V-shape of the machine capacity graph with the core stage at the base point (which explains the name V-graph), as shown in see figure 3. The speed of the machines and the conveyors is adapted on the basis of sensor signaIs, which indicate whether a conveyor segment (i.e. a buffer) is full or empty. Most machines have several speeds. Often parallel machines are used for a stage, where each machine has extra capacity, so if one of more ofthe parallel machines fail the ot her machine(s) can run at a higher speed to compensate for the failed machine(s).
10
CHAPTER 3
DEFINITIONS
In this chapter the efficiency of a packaging fine is defined and the fine parameters that injluence the line efficiency are described. These fine parameters are divided in machine parameters and buffer parameters.
3.1
Efficiency
The efficiency of a packaging line is the percentage ofthe actual production versus the possible production, for a given period of time. This is the number of filled bottIes or cans versus the possible number offilled bottles or cans in a specified time period. It can also be defined as the percentage of the time that is theoretically needed to produce the actual output (=net production time) versus the actual production time. The time definitions for packaging lines are shown in figure 4.
Line Efficiency The line efficiency 1]line is a measure of the efficiency of the packaging line during the period specified, and is ca\culated as follows :
1J:
=
hne
net production time x 100% actual production time net production time . . x 100% net productlOn ttme + internal unplanned downtime
External unplanned downtime is excluded because this downtime is not caused by the operation of the packaging line itself; taking external unplanned downtime into would result in an indicator for the efficiency of the organisation instead of just the packaging line· . Also extemal unplanned downtime is hard to rneasure As the net production time is equal to the output in production units divided by the nominal line capacity, the Line Efficiency specified in production units is: . = 1]lme
output in production units x 100% actual production time x nominalline capacity
where the actual production timet on the core machine (group) is taken as the actual production time and the nominal line capacity is the nominal capacity of the core machine (group).
In the Brewery Comparison System (BCS) [2] efficiency is defined as the percentage of the net production time versus the available production time. In this report, however the fine efficiency is considered. t The actual production time is usually the measured time (per production run) between the first bonle into the filler and the last bottle out of the filler minus time lost due to disturbances not under control by direct shift employees, e.g. electricity breakdown, no beer. etc.
11
TOTAL TIME
GROSS AVIALABLE TIME
AVAILABLE PRODUCTION TIME
..
NET PRODUCTION TIME
:.:. :,, ;;:;:::::::::::::::::::::.::"::::
DQWNTiME
....
internal external ACTUAL PRODUCTION TIME
Figure 4: Time definitions of a packaging fine Total time The total time is the duration of the period specified. Unused time The unused time is the time that the packaging line has not been utilised for either actual production, planned or unplanned downtime during the period specified. This includes holidays, strikes, time not worked according to work schedule (e.g. Sundays), and no shifts planned according to production plan. Gross available time The gross time available (or manned time) is the total time minus the unused time, i.e. the total time that the line is with personnel. Planned downtime The planned downtime is the time used by the packaging line without producing, according to the standards used in the production plan. This includes start and finish time periods, cleaning, maintenance/overhaul, changeover time periods, test runs, and idle time (shift available, no work). Available production time The available production time is the manned time minus the planned downtime. This is the time which is intended for production. Unplanned down time The unplanned downtime is the time that the packaging line has been occupied with unplanned stops during the period specified. The total unplanned down time is divided in intemal and extemal unplanned downtime. Internal unplanned downtime The intemal unplanned downtime is the total unplanned downtime caused by the packaging line functioning in the time period specified. This includes time loss because the average speed is different to nominal speed, additional maintenance (extra to planned), ed and non-ed stops. External unplanned downfime The extemal unplanned downtime is the unplanned downtime not caused by the packaging line functioning in the time period specified. This includes time loss because there are no empties, no beer, no electricity, or no transport available, non-planned changeovers, planning mistakes. Net production time The net production time is the time that the packaging line has been occupied with production during the period specified calculated as actual output divided by the line capacity. This is also called the theoretical production time, because it is the time in which the actuaI output could have been produced given the line capacity.
12
If the filler is the core machine, th en the filler determines the line efficiency except for a time difference between the time of production at the filler and the time of output at the end of the line (which inc\udes the pasteurisation time of 4S-60min) and the rejects and breakage aft er the filler (which is usually less than 1%). Therefore, in the efficiency analysis ofpackaging lines the focus is on the loss of production time of the filler (or co re machine), which is almost equal to the difference between the actual production time and the net production time (i.e. the intemal unplanned downtime). Note that loss ofproduction on the core machine cannot be recovered, so the production time ofthe core machine determines the (maximum) output ofthe line. Although the line efficiency is the main performance indicator for packaging lines, the utilization (defined as the net production time versus the total time), and the effectivily (defined as the available production time versus the manned time), are also important in analysing the performance of a packaging line. In other words whereas efficiency analysis focuses on the reduction of intemal unplanned downtime, the reduction of unused time, planned downtime, and external unplanned downtime, can obviously also improve the line performance. In this report quality is not considered, nevertheless this is of course an important performance indicator. Finally, the output of a packaging line is a very important, simple and useful performance indicator.
3.2
Line parameters
A packaging line consists of the different stages of the packaging process, and for each stage one or more (parallel) machine are used. In other words a packaging line is a series system, with the machines or machine groups as components, and these machines are connected by conveyors/buffers. This is depicted in tigure 5, in which the buffers upstream of the core machine are full and the buffers downstream are partly empty. The line efficiency is then determined by the line parameters, which are formed by the machine parameters and the bl!l!er parameters'.
buffer machine
buffer machine
buffer core machine
buffer machine
machine
Figure 5: Packaging line as series system
The mfluence of other aspects (mcludll1g some aspects that are hard to quantIty, hke the weather, the experience of the operator, the quality of the material etc.) is not considercd separately but assumed to be incorporated in the failure behaviour of the machines (which therefore varies).
I
I I
l-"nrr-,,,- - - - , - - r - - , - - - -
13
3.3
Machine parameters
The machine parameters are the machine states, the failure behaviour, the machine efficiency and the machine product ion rates.
3.3.1 Machine states Each machine can be in one of six states·: Running A machine is running when it is producing, this can be different speeds and with different reject rates. Planned down A machine is planned down in the case the machine is stopped for planned mainlenance, changeovers, nol in use, elc. Machine in/emailai/ure A machine has an interna! failure when the machine stop is caused by a machine inherent failure. There are often many different fai!ures causes depending on the complexity of the machine.
Machine exlernal failure A machine has an exlemal failure when the machine stop is caused by extemal faclors, either caused by another part ofthe organisation (e.g. no supply of empties, no beer, no electricity, etc.)!, or by the operator(s) of the line (e.g. lack ofmaterial such as labels, cartons, glue, etc.) and waiting time. Slarved A machine is starved (or idle) when the machine stop is due to a lack of canslbott!es or cases. The machine has no input, i.e. the conveyor preceding the machine is empty, because of a reason upstream on the !ine. Note that some machines can be starved for more than one reasons, e.g. a packer can be starved for bottles and for boxes. Blocked A machine is blocked when the machine stop is due 10 a backup of canslbottles or cases. The machine has no room for output, i.e. the conveyor succeeding the machine is full , because of a reason downstream on the !ine. Nole thaI some machines can be blocked for more than one reason, e.g. a depalletiser can be blocked by pallets and by crates.
Hence, a machine is either running, or a machine is not running for one of five reasons. The state 'planned down' and part of the state 'machine external failure ' are not included in the calculation. Therefore the loss of production time on the co re machine (i.e. the internal unplanned downtime) consists of the tot al time the core machine has an internal failure or an external failure due to the operation of the packaging line, and the tot al time the core machine is starved or blocked. This means that efficiency loss can be caused in three ways: either stops (of lower speed) due to the core machine itself, or due to stops upstream of the core machine, or due to stops downstream of the co re machine.
Sometimes it is hard to differentiate belween machine intemal failures and machine external failure (e.g. poor qua!ity materiai), or between machine extemal failures and starvationlbackup (e.g. material). The above definitions are based on the assumption that failures are due to the machine (i.e. machine intemal failures), related to the machine (machine extemal failures) or due to other machines of the line (starved and blocked). t This results in extemal unplanned downtime.
14
3.3.2
Machine failure behaviour
The intemal failure behaviour of a machine is usually described by the means of two (unknown) probability distribution functions': a distribution function for the internal failure or repair times and a distribution function for the running timest. The expectation of the failure or repair time distribution is called Mean Time To Repair (MTTR). The expectation of the running time is called Mean Time Between Failures (MTBFl These are defined as follows for the period specified: total time intemal failures MTTR = Mean Time To Repair = - -- - - -- -number of internal failures total running time MTBF = Mean Time Between Failures = - - - - - - - - ' = ' - - - - number of intemal failures The total time of intemal failures is simply the sum of the intern al failures during the period specified, and the running time is the total time the machine is in the state 'running'. 3.3.3
Machine efficiency
The machine efficiency 1]machine is a measure for the availability of the machine. It is defined as the percentage of time that the machine is ready to operate, for the period specified: . = 1]mac hme
total running time x 100% total running time + total time internal failures
The machine efficiency is the time the machine produced versus the time the machine could have produced. Obviously, the total planned downtime, external failure time, starved time and blocked time are not taken into for measuring the machines availability. Also the machine speed is not considered. The machine efficiency is equal to: n
'I machme
=
MTBF MTBF + MTTR
X
100%
The efficiency of a group of parallel machines is the sum of the machine efficiencies of the machines group, weighted with the proportion of the group capacity formed by the machine capacity .
• Often these distribution functions are assumed to be exponential distribution functions.
t Alternatively the failure rate can be specified in of numbers per million, e.g. 200 stoppages per one million produced bottles or cans. This means that no matter how fast the machine is running the failure rate will be the same. This might be more in kceping with the quality specifications of the material which is also in units per million (or rather a percentage), and it miglll also explain why machines often show more failures at higher speeds (i.e. because of the constant failure rate the mean time between failures is shorter at higher speeds). On the other side, however, al higher speeds also the circumstances (e.g. temperature, trembling, etc.) are often different. t The MTBF is based on running time and not on clock time. Implicitly this assumes that a machine cannot fail while being forced down (e.g. starved of blocked).
15
3.3.4 Machine production rates The production rates ofa machine (group) are defined as follows:
Machine speed (VmacJ The machine speed is the number of products the machine produces per unit of time. Machines can have fixed , pre-selected, or continuously variabIe speeds. Usually machines have an overspeed, a low speed and one or more speeds around the nominal machine capacity. Machines can have different speeds for different product types. Machine capacity (CmaclJ The machine capacity is the maximum machine speed as set in the machine contro\. Machines can have different machine capacities for different product types'. Group capacity (Cgroup) The group capacity is the total maximum production speed of the parallel machines that form the group, as set in the contro!. This can be lower than the sum ofthe machine capacities. Nomina/ machine capacity (Cno"J The nominal machine capacity is the speed of the machine for which the group to which the machine belongs runs at the same speed as the co re machine (group); it is determined by the nominalline capacity divided by the number of machines ofthe group. Machine overcapacity (Omach=Cmach - C"o"J The machine overcapacity is the difference between the machine capacity and the nominal machine capacity. Group overcapacity (Ogroup=Cgroup- Cu".) The group overcapacity is the group capacity minus the nominalline capacity. Core machine (group) One of the machines (or groups) of a line will be the core machine (group) or critical machine (group). The co re machine (group) is defined as the machine (group) on which all the line equipment and conveying system parameters are dimensioned. The capacity of the core machine (group) determines the maximum output of the line. Therefore the nominal line capacity is equal to the capacity ofthe core machine (group). Nomina/line capacity (CUn .) The nominalline capacity is the smallest machine (group) capacity for the specific product, i.e. the capacity of the core machine (group) for the specific product. From this follows that a packaging line can have different line capacities .
• The technical maximum machine speed can be higher than the (control) machine capacity, the difference is called the unused capacity.
16
3.4
Buffer parameters
The goal of the buffer strategy is to mini mise the influence of the different machines on each other and especially on the core machine (most often the filler), by accumulating additional supply before the core machine and creating space after the core machine. In other words the buffers for bottleslcans and crates/cases/trays' between the machines provide accumulation. There are two types of accumulation: dynamic accumulation and static accumulation. Dynamic accumulation is accomplished by the conveyors between the machines. Static accumu!ation is achieved by putting a rea! buffer between machines. Buffers which are used to avoid starvation of the preceding machine, are called antistarve buffers (these are found upstream ofthe core machine); buffers which are used to avoid backup of the succeeding machine, are called anti-block buffers (these are found downstream ofthe co re machine) . Accumulation Accumulation is referred to as the time a machine is allowed to stop without disturbing the operation of the machines around it. There are two types of accumulation: dynamic and static accumulation. 3.4.1 Dynamic accumulation Dynamic accumulation is accomplished by the conveyors between the machines. For bottles and cans these conveyors consist of parallel chains, of which some chains are used for transport, and the other chains are used for accumulation. For cases, crates and trays these conveyors are usually one unit wide and the accumulation is achieved by the spacing of the units. The functioning of dynamic accumulation differs for anti-starve and anti-blo ck buffers. Anti-starve buffers The purpose of anti-starve buffers is to prevent that the machine following the buffer becomes starved when the machine before the buffer has stopped. These buffers are therefore found upstream of the core machine. In figure 6 the functioning of this type of buffer is shown. Theoretically the ideal state is wh en the buffer is full. For bottlelcan conveyor this means that both the buffer and transport chains are full; for case/crate/tray conveyors this means that there is no space between the units. Anti-b/ock buffers The purpose of anti-bloek buffers is to prevent that the machine before the buffer beeomes blocked wh en the machine after the buffer has stopped. These buffers are therefore found downstream of the core machine. In figure 7 the functioning of this type of buffer is shown. Theoretically the ideal state is when the buffer is empty. For bottlelcan conveyor this means that the buffer chains are empty and the transport chains are full; for case/crate/tray conveyors this means that th ere is space between the units .
• Pallet buffers (full or empty) are not considered here, but can be approached in a similar way
17
Anti-starve buffers Tbe purpose of anti-starve buffers is to prevent that the machine after the buffer becomes starved when the machine before the buffer has stopped. Tbese buffers are therefore found upstream of the core machine. Tbe idea1 state is when the buffer is full, the machine after the buffer is constantly supplied with containers. When before the buffer a failure occurs, the machine after the buffer can continue to run and drains the accumulated containers from the buffer. This lasts for a certain period of time, the so-called accumulation time. At the end of this time period the machine that stopped, has to start running again, otherwise the machine after the buffer stops because it is starved. Because of the overcapacities the ideal state is recovered. State 1: Tbe buffer is fully filled and working. Tbc machines MI and M2 are both running. Tbis situation is called the ideal state. State 2: Machine MI has a failure or is starved by a failure further upstream. The buffer content is decreased by M2 with speed Sb. A gap is created in the bottle or can flow, because MI is no longer producing.
State 4 and 5: Tbe overtaking flow approaches the end of the production flow, because of the speed difference. Tbe production flow disappears with the machine production speed and the overtaking flow draws near with the speed of the conveyor.
:
Pstarve
MI _ _ M2 State 2:
MI
E3II. .IIM2
. :.
State 3:
MI State 3: Tbe bottle/can flow reaches the 'critical point' Peri!' by the critical time Tcrit=Lbulre/SC. No later than this point MI has to start running, such that with speed Sc the overtaking container flow can fill up the created space, before it reached the starve point Pstarve of machine M2 (i.e. the sensor that signals the lack of bottles and stops machine M2).
: Perit
State 1:
~==- M2
-
State 4:
MI
~ .. .._=-----_ .. -
State 5:
-
Sc
I. . . . .
-
>................................ ... .................
State 7:
M2
Sb :
-
State 6:
MI
=3II : .. ••
Ili
M2
MI _ _ M2
Statc 6: Tbe overtaking flow reaches thc production flow, before it has reached the starve point. M2 can continue running, without noticing the failure of machine MI .
-
Time-Length diagram
T Teritl -
State 7: Because M2 runs at a lower speed than MI (i.e. MI has overcapacity with respect to M2), the buffer has filled up again. Tbe ideal state is recovered.
T,"l
:Perit L erit
Figure 6: Anti-starve buffers 18
L
Anti-block buffers Tbe purpose of anti-block buffers is to prevent that the machine before the buffer becomes blocked when the machine after the buffer has stopped. These buffers are therefore found downstream of the core machine. The ideal state is when the buffer is empty, i.e. only the part of the conveyor used for transport is full. When after the buffer a failure occurs, the machine before the buffer can continue running and fiUs the buffer with containers. This lasts for a certain period of time, the so-called accumulation time. At the end of this time period the machine that stopped, has to start running again, otherwise the machine before the buffer stops because it is blocked. Because of the overcapacities the ideal state is recovered. State I: Tbe transport part of the conveyor is filled, the buffer part of the conveyor is empty. Machine M2 is running. This situation is called the ideal state. State 2 and 3: Machine M2 has a failure or is blocked by a failure further downstream. Tbe backup of containers builds in the direction of machine MI. State 4: The backup reaches the 'critical point', M2 has to start running now, otherwise MIgets blocked (i.e. the sensor that signals the backup ofbottles stops machine MI).
State I:
: Pblock
State 2:
MI State 3:
MI
---
~_M2
____ M2
State 4:
MI
State 5 and 6: Machine M2 has started running again. Because of the overcapacity of M2 with respect to MI the container flow decreases. The buffer part ofthe conveyor is drained .
State 5:
State 7: The ideal state is recovered.
MI
MI
~_M2
State 6:
State 7:
---
Time-Length diagram
T
Figure 7: Anti-block buffers
L 19
Bottle aDd cao cODveyors
w
Figure 8: Bottle or can conveyor
For a given bottIe or can conveyor+:
w o
width (in mm) bottle or can diameter (in mm) line capacity (in bottles/min or cans/min) number ofrows ofbottles or cans standing on the width ofthe conveyor
ROUND[ 0·W -0 + 1] cos300 Nm Sb
Sc Lbufler
p
1000 number ofbottles or cans per meter of conveyor = Nb x - -
o
speed ofbottles in translation (in mlrnin) when the conveyor is filled with botdes on its whole width Nm chain speed ofthe conveyor length ofthe buffer, taken as the distance between the block and the starve sensors. population ofbottles or cans on buffer chains ofthe conveyor over the length of the buffer as a percentage ofthe maximum number ofbottles on the buffer chains ofthe conveyor over the length ofthe buffer
Of course the machine failure need not occur when the buffer is ful! or empty, this means that an optimal accumulation is only possible when the buffer is full or empty. This leads to two buffer times, a nominal accumulation, i.e. the accumulation in the ideal state and the (actuaI) accumulation, that depends on the present population of the buffer, i.e. the fillievei.
fillievel of conveyor as the percentage ofthe number ofthe containers on the buffer versus the possible number of containers on the conveyor. nominal fill level, defined as the fil! level of the conveyor in the ideal state as set in the co nt rolt .
• If a conveyor consists of different segments, with either different widths andlor different speeds, the accumulation is calculated for each segment separately and these are then added together. t The maximum number of containers on the buffer can be even higher, but because of machine control and quality reasons (bottle/can damage, label damage, etc.) extra space between the container is achieved in the control. This is called the unusedbuffer capacity.
20
Nominal accumulation The nominal accumulation is the accumulation when the buffer is in the ideal or nomina! state, i.e. the state when the line is producing without failures . The nomina! accumulation is equal to :
(1 Ij
nom -L Tace - buffer . Sb- -S
For anti-starve buffers this means that the nominal accumulation is equal to the time it takes to empty the full conveyor over the length of the buffer minus the time is takes for bottles to travel the length ofthe buffer (see also figure 6). For anti-block buffer this means that the nominal accumulation is equal to the time is takes to fil! the conveyor over the length of the buffer minus the time is takes to fil! the transportation part ofthe buffer (see also figure 7).
Actual accumulation The actual accumulation is the accumulation that the buffer provides when the conveyor is an a given state. The state is described by the population ofbottles on the length ofthe buffer. p T -L . -I - ) ace - buffer ( Sb Sc
(I-P 1)
Tace -L - bulTer . - Sb- - -Sc
for anti-starve buffers
for anti-block buffers
For anti-starve buffers this means that the actual accumulation is equal to the time it takes to empty the conveyor over the filled length of the buffer minus the time is takes for bottles to travel the length of the buffer (see also figure 5). For anti-block buffer this means that the actual accumulation is equal to the time is takes to fil! the conveyor over the free length of the buffer minus the time is takes to fill the transportation part of the buffer (see also figure 6). From this fol!ows that the nominal population of anti-starve buffer is 100% and of anti-block buffers 0%. This does not mean that the whole conveyor is filled or empty, just the conveyor over the length of the buffer. The nominal jill level of the conveyor is then around 90% of the maximum nu mb er of bottles on the conveyor for anti-starve buffers and around 50% for anti-block buffers. When the chains and bottles are moving at the same speed (Sb=Sc), there is no accumulation (Tacc=O), because there is no possibility to catch up a gap in the flow in accumulation sections upstream of the core machine, or to empty the overfil!ed accumulation sections downstream of the co re machine. When the chain speed goes to infinity (Sc~CXl) the accumulation goes to the quantity ofbottles the conveyor can accept (=Lbuffe/Sb), so the higher the chain speed, the higher the accumulation (tending towards the maximum).
21
Because the line capacity is used in ca1culating the accumulation, these accumulations can be added to get the tota! accumulation of each machine with respect to the core machine (filIer); in rea!ity, however a machine may be forced down in a shorter time than the accumulation, because of the machine overcapacity, or in a longer time than the accumulation, because of the machine low speed. The accumulation should therefore be regarded as the effective accumulation, with respect to the line capacity, i.e. the core machine. After the accumulation has been used the buffer has to be restored to its nomina! state, this is achieved by the speed difference between the machine before the buffer and the machine after the buffer. accumulation to be regenerated, i.e. the duration of machine stop (in min) capacity of the machine that has had a stop
T,top CM
Nominal recovery time The nomina! recovery time is the time needed to regenerate the nominal accumulation, in other words the time needed to restore the buffer to its nomina! state after a machine stop as long as the nominal accumulation. T nom
ree
=
Toom ace
X
C
hne
C M - Cline
This means that the number of bottles or cans that were removed from or put on the conveyor during the nominal accumulation (=the numerator) is recovered with the speed difference between the machine that has had a stop (and now running at its maximum speed) and the line capacity (= denominator). Ac/ual recovery time The actual recovery time is the time needed to regenerate the accumulation that has been used by the machine stop(s). Stated differently it is the time the machine that has had a stop, has to run at its maximum speed.
This means that the number of bottles or cans that were removed from or put on the conveyor during the stop (=the numerator) is recovered with the speed difference between the machine that has had a stop (and now running at its maximum speed) and the line capacity. Again, because the line capacity is used in ca1culating the recovery time, these times can be added to get the total recovery time of each machine with respect to the core machine; in reality, the recovery time of a buffer may be shorter because of a bigger speed difference or longer because of a smaller speed difference. The recovery time should therefore be regarded as the effective recovery time, with respect to the line capacity, i.e. the core machine. The bigger the speed difference (or how steeper the V-shape of the V-graph) the faster machine stops can be recovered.
22
Case, era te and tray eonveyors For case/crate/tray conveyors the accumulation is generated by the space between the cases. For a given case/crate/tray conveyor: Cline
Lc Sb Sc
N Lbuffer p
line capacity (in bottles/min or cans/min) length of a case (short side leading) or width of a case (long side leading). speed of cases in translation (in mlmin), with either a case population p or a di stance d between two consecutive cases chain speed of the conveyor Chne X Lc C line X (Lc + d) number ofbottles or cans in a case = ---"""----- or N xp N length ofthe buffer, taken as the di stance between the block and the starve sensors population of cases on the conveyor over the length of the buffer as a percentage of the maximum number of cases on the conveyor over the length of the buffer
Otherwise the formulas for bottle and can conveyors apply 3.4.2 Statie aeeumulation Static accumulation is accomplished by accumulation tables between the machines. Such a table (or stack) is placed next to the conveyor and is often called an ebb and flow tabie. When the conveyor is full the table start to fill, when the conveyor is no longer full the table starts to empty as shown in figure 9.
L
L
Figure 9: Accumulation tab Ie For a given tabie: W L Cline
table width (in mm) table length (in mm) bottIe or can diameter (in mm) line capacity (in bottles/min or cans/min)
N
possible number of bottles or cans on the table = ROUND[ 0
p
possible number of cases, crates or trays on the table population standing on the table as percentage ofN
o
23
~c:s~oo x ~ ]
Nominal accumulation The nominal accumulation is the accumulation when the buffer is in the ideal or nominal state, i.e. the state when the line is producing without failures. The nominaI accumulation is equaI to: N T nom = - ace
Cline
Actual Accumulation The actuaI accumulation is the accumulation that the buffer provides when the conveyor is an a given state. The state is described by the population ofbottIes on the length ofthe buffer. pxN Tacc = for anti-starve buffers
-c-line
Tacc
=
(!-p)xN C
for anti-block buffers
hoe
The formulas for recovery are the same as those for dynamic accumulation.
3.5
Setting the line parameters
Some line parameters can be changed (e.g. the machine speeds, the conveyor speeds, the location of the sensors), other parameters vary (e.g. the failure behaviour of the machines). Most line parameters are limited by the line design: the machine capacity, the length ofthe conveyor. Within these limits there is some room to tune the line parameters to improve the line efficiency. Ideally, in the line design the slope of the V-graph and the buffer capacities between the machines are determined by the failure behaviour of the machines. The accumulation is adjusted to the MTTR and the recovery time is adjusted to the MTBF. However the exact failure behaviour of the machine is of course not known in advance. So, data of comparable machines must be used and a sensitivity analysis should be done. Once the line is installed, a true value of the line parameters becomes known. Then efficiency analysis should give an indication which line parameters should be changed to improve the line efficiency.
24
CHAPTER
4
DATA
In this ehapter the data aequisition proeess is diseussed. The fine monitor system is deseribed and the methads to determine or estimate the fine parameters are explained. Process registration is not a goal by itself, but should help to improve the performance of the packaging line or department (e.g. by increasing efficiency or decreasing losses) [25]. In keeping with this principle it should be determined what process data is collected and with what level of detail. This normally is a leaming process, during which experience on other packaging lines or even ot her industries can be helpfuI. Naturally the costs and benefits ofregistration should be considered, although this is not easy. The base for good data acquisition is a set of sound definitions of what is to be recorded. For a registration system to succeed the purpose and use of the registration have to be dear. The organisational and technical possibilities and constraints have to be considered. Data acquisition can be done manually, automatically or both. Manually recorded data is of course less accurate, less detailed, and more subjective than automatic recorded data. However, although the amount of collected data manually is smalI, it is often more relevant and often has an interpretation, because only incidents or exceptions are reported and an explanation is added. Automatic or electronic data acquisition gives much more data, because every event is recorded, and the data is ' objective' , meaning recorded as defined, but often events need to be explained or additional information is needed. Therefore in practice manual and automatic data registration are combined. Both electronically and manually recorded data are entered into a database. Ideally this database is easy to use, i.e. aggregation, graphs etc. can be made quickly with fiiendly tools. Registration can be continuous, e.g. a line monitor system (automatic registration) or a shift event list (manual registration), or registration can be temporarily, e.g. during the installation or upgrading of a packaging line, in which case extra equipment and personne\ is used .
4.1
Registration
The data of a packaging line can be divided in statie and dynamic data. 4.1.1 Statie data The static data of a packaging does not change during production and determines the configuration of the packaging line, e.g. the machine capacities, machine contro\, the configured machine speeds, and the conveyor width, length and speed. Most static data can be easily collected by measurement. An important tooi in ascertaining these data is the so-called fine logic.
Line logie The line logic is a description of the conditions of the states of the machines and buffers of a line. It can be shown as a set of figures of each machine and its surrounding conveyors and a logical table ofthe state conditions, or the state conditions are depicted . Basically it is a description ofthe contral ofthe machines by the signals ofthe sensors on the preceding and succeeding conveyors (see also appendix A). 25
--
« •
ft
-
4.1.2 Dynamic data The dynamic data of a packaging line consists of data that is changing. This type of data consists of all line events (or production events), e.g. machine state changes, machine speed changes, number of units produced, buffer fill grade, production planning etc. The line event data can be collected automatically and manually.
Automatic data collection The layers ofthe line monitor system for automatic data collection is shown in figure 10. The purpose of a Line Monitor System (LMS) on a packaging line is to give insight into the functioning of the packaging line and to improve the performance of the packaging line. An LMS has three tasks: monitoring, visualising, and recording the line performance. The process registration can consist of a host of counts, timers, signals etc. The machines and conveyors of a packaging line are each controlled by a so-called Programmabie Logic Controller (PLC). This is a computer using a program code for the process tasks. The PLC' s give signals or instructions to the machines. These PLC' s are connected by a network. The signals of the PLC's are collected by the Supervisory Control And Data Acquisition (SCADA) system. This system visualises the machine and line information on monitors for the operators. The operator also receives signaIs directly trom the machines from differently coloured light bulbs or text displays. From the SCADA system the data is stored in a database. Planning information and other information can be collected through links with other computer systems or databases.
Database
Other systems
Visuafisation
SCADA
Figure 10: Layers of a fine monitor system
Manual data collection The basic form of manual data collection is the operator writing events on a event list. A modem version of this is typing events directly into a computer system or pushing touch buttons on a computer screen when an event occurs. Or in combination with an automatic data collection system it is just adding remarks to the recorded events afterwards. In appendix B the basis registration is discussed. This gives an impression ofthe data that should be collected for the efficiency analysis of packaging lines.
26
4.2
Database
Both electrorucally and manually recorded data (static and dynamic) are entered into a relational database. The data model ofthis relational database is very impo rtant, because the features and possibilities of data analysis are partly determined by il. I,inks with other databases (e.g. product data, planning data, maintenance data) allow more sophisticated analysis (for instance by detecting relationships). The data manager should filter out irrelevant data and Iloise or errors 10 keep Ihe analysis reliable. He creates standard reports of the packaging line and ad hoc t(ueries ir asked. Ideally the database is easy to use, i.e. queries, aggregation, graphs cic. can be made quickly with friendly tools. Of course the features of the database systcm that are used and needed depend on the detail of the data and the detail of the analysis An useful feature of an registration system is the use of several counts to calculate the same quantity as a verification of the value.
4.3
Visualisation
The SCADA system usually also offers visualisation. Visualisation give an on-line representation ofthe packaging line data in text and/or graphics, e.g. the machine state is shown in a machine drawing or the production progress of the current order is shown. The system should lead to shorter machine stops, because of the information it provides to the operator on the cause (and the cure) ofthe stop, and also lead to less excess order production because of the more accurate information on the production progress. The visualisation system should be flexible and configurable, have a consistent and friendly graphical interface (GUl), and be expandable. What is shown on the screens must be based on careful consideration and be recorded in clear definitions. Especially the consistent use of colours is helpfuI. An important feature of a visualisation system is the possibility to create so-called historicals or trends, i.e. graphs of the course of events or machine speeds, buffer contents (see figure 11). Other examples are the development of the MTTR and MTBF over time, the nu mb er of failures etc.
4.4
Line parameter estimation
The data collection can be used to determine the value of the line parameters. The methods to estimate the line parameters are discussed below.
4.5
Machine parameters
The machine parameters are the machine states, the failure behaviour, the machine efficiency and the production rates. 4.5.1 Machine state Recording the machine state amounts to recording the start time and end time or duration of the machine state event as signalled from the PLC. Most machine states are defined in the line logic. However it is not always possible to distinguish the different states, for instance when an operator who opens a machine to clean it, this is automatically recorded as a machine failure, while in fact it could be planned downtime. The detail of recording will also vary. Automatically the machine states are known every single second, manually this is of course not possible.
27
Usually some extra data is added to the machine states. For a starved machine the material it is starved for (botties, cases, pallets etc.) is added; for a failure the cause as provided by the machine sensor signals is added. Sometimes a machine can be in different states, e.g. blocked and failed when an operator opens a blocked machine. Then either everything is recorded and filtered later so that a machine can be in one state at a time· , or the filtering is done in the PLC, losing data but reducing the data flow. The most common filtering methods arefirst-up (with memory), meaning the machine remains in the first state until this state ends and then the machine assumes the next state; or priority, meaning that each state has a priority weight and that of the present state is the one with the highest priority. Something sirnilar is often do ne for the failure causes. As there are many different types of machine failure and often one failure leads to an other, so again filtering can be applied. 4.5.2 Machine failure behaviour The estimation of the machine failure behaviour is done through estimation of the MTTR and the MTBF t The following sample estimators are common: MTTR:
~ n
i
1;fail
= 'ffail
i=1
1
m
L
MTBF: 1;run = m 1=1
I
run
with: n m 1;fa,1
number of internal failures number of run times = n ± 1 internal fail time i, i= 1, ..., n
1;rWl I fail I rWl
run time i, i= 1, ..., m average internal fail time average run time
The corresponding confidence interval can be approximated as follows (ifn is large): .
- tàil
MTTR. [ T
-run
MTBF: [ T
Sf.il
sfail ]
- rail
- Zl_~'
J;;' T + ZI _~ . J;;
- ZI _~'
srun -rWl srun ] rm' T + ZI _ ~' rm
with: Z I _~
the value of an standard normal distributed random variabie X for which
P(X:S:: ZI_~ )= 1- Vza
a sfail
confidence level, usually 5% estimated stanáard error of the internal failure times Tt· il
A separate state 'failed and blocked' ean also be defined. t Depending on the definition ofMTBF the run times or cloek times between failures are used
28
1
0
_-2:(1;'"0 _ 'f rf• il ) 2 n - 1 i= 1
srun
estimated standard error of the run times 1;run 1 m
-I(1;nJIl - ï nJll1) 2 m-l
i= l
A confidence interval is a measure for the accuracy of the estimate. With a chance of l-a the confidence interval contains the true value of the estimated quantity. The more observations in the sample the smaller the confidence interval (as can be seen in the above expressions the width of the confidence decreases width the square root of the number of observations, i.e. approximately 4n observations re sult in a confidence interval half as widef. Note that the estimates are only a ' snapshot' of the current situation (or period specified), because the failure behaviour of the machines varies. Therefore the changes of the parameter values should be monitored and for estimation a representative sample should be used. Also exceptions should be excluded trom the estimation. Often graphical tools can help in estimating a parameter.
4.5.3
Machine efficiency
The machine efficiency .
7]machine
is measured straightforwardly for the period specified:
=
total running time x 100% total running time + total time intemal failures
=
MTBF x 100% MTBF + MTTR
7]mochme
or: 7]m.chioe
In practice, these ca1culation often include waiting time for an operator or mechanic to arrive. Then the machine efficiency is not the pure machine efficiency but the effective machine efficiency. For installation tests the pure machine efficiency should be measured.
4.5.4 Machine production rate The machine production rates can be measured with the counts of production and rejects of the inspection equipment or the machine display. The conditions for the different production rates are described in the line logic. These conditions can be created or mimed with the sensors. Another method uses a historicalof the machine speed over a longer time period, and checks the different machine speeds that occur (see figure 11). An important tooi in controlling the packaging line is to check if the configured speeds in the control correspond with the speeds of the line design. Often machines are shifted down when problems occur or because this create a more even flow . However, trom a line efficiency point ofview this may not be desired. Normally the number of units produced and rejects are recorded for each machine, ifpossible. This enables the calculation ofthe line efficiency .
• If we assume tbe distribution of tbe failures to be exponential tbe confidence interval can be calculated exactly using a gamma distribution (see [7] and [8))
29
L ' - - _.,._ •• '
4.6
• ' . _ - - "'_" - ,
Buffer parameters
The buffer parameters are the accumulation and recovery times of the buffers. Basically there are two estimation methods. The first method caIculates the buffer sizes with the equipment specification or measurement of the length and width of the conveyors in real or trom the layout. Then the machine speeds are used and the conveyor speeds trom the line design are used. And of course the size ofthe bottIes/cans or cases/cratesJtrays. The second method measures the accumulation by experiment. So the real machine speeds and conveyor speeds are measured, Then the conveyor contents as set by the control are measured by tests, For instance the buffer between two machines is measured as follows: First stop the machine before the conveyor and let the machine after the conveyor empty the conveyor completely. Then start the first machine again and measure both the time it takes for the second machine to start again and the number of units on the conveyor before the second machine starts again. This is the transport part of the conveyors. Then stop the second machine and measure how many units can be placed on the conveyor by the first machine, resulting in the maximum conveyor fill level. So, the buffer content is simply what is put on the conveyor by the machine before the buffer minus what is taken of by the machine after it, taking into rejects and machine contents, The values for both methods can differ because the spacing of the units is set in the control (e.g, to decrease the pressure on the bottles) and the location ofthe sensors affect the effective buffer. Changes in contral often also change then accumulation and recovery, Using a trend' ofthe buffer contents and machine speeds ofthe machine before and after the machine (see figure 11) the buffer capacity, accumulation and recovery can also be monitored over time,
Machine speed
r
" machine 1 - - machine 2
Buffer
buffer
contents
60000
r 4000
40000
3000 20000 1000
o time~
Figure 11: Trend of machine speeds and buffer contents
• The counting of the contents of the buffer has to be reset every once in a while to avoid differences. For instanee reset when the buffer is completely empty of full,
30
'-'---I
The nominal fill level of the conveyor can be ascertained by monitoring the buffer for a certain time in which the machine before and after the buffer function without failures. In that case the machine speeds usually modulate around the nominal machine capacity. These speeds are controlled by the sensors on the conveyors, so also the buffer content modulates between two levels. For example the machine after the buffer runs faster than the machine before the buffer until the buffer content is decreased to a certain level, then the machine after the buffer slows down and the buffer content is increased to a certain level, and then the machine after the buffer shifts up again etc. The nominal fill level is now chosen as the higher level for anti-block buffers and the lower level for anti-starve buffers. Monitoring the buffer contents can also be useful for determining when to start a neworder. In other words ifyou know how many product there are on the line you know almost exactly when an order is finished.
4.7
Organisational aspects
Technically there are few limitations for a Line Monitor System (LMS). However, some technical and organisational efforts are to be expected. Technical efforts, because the data collection should receive input from the ProgrammabIe Logic Controllers (PLC's) ofthe line equipment, this often requires reprogramming or extra programming. The visualisation also requires some effort. And the LMS needs a stabie network, hardware and software environment to ensure the continuity of the data collection. Organisation efforts, because the introduction of a LMS first of all requires a functional specification, i.e. a description of the possibilities and features the system must have. After the system has been installed the s have to be trained and the system should be managed and adapted. Using the LMS should be an integrated task of those involved with the packaging line for the system to be really used successfully. The use of the system depends on the tools it offers and its friendliness. Data processing should be fast for standard reports and flexible for ad hoc queries. Often systems are discarded because of the Iimitations of the system or the uncIear and complicated use. The LMS should built step by step. Creating a overall complete system is simply a technical risk. A1so it is not optimal, because the organisation then does not have the opportunity to leam, and expand the system as needed. A cost-benefit decision is impossible and s are hardly involved. This could result in a more than complete (i.e. with a host ofunknown and unnecessary features), technical perfect, yet unused LMS. The first step in building a LMS should be a to determine what kind of system is needed and what is expected from the system (the functional specification). Most LMS systems are adapted versions of standard software packages, but also tailor made system exist, each with their own (dis)advantages. A1though costlbenefit analysis is often hard for information technology projects, because some benefits are hard to quantity (e.g. more involvement of operators with the machines, a better overview of the line, etc.) some sort of costlbenefit decision should be made with each expansion ofthe system.
31
CHAPTER
5
ANALYSIS
This chapter describes various mathematical methods lor efficiency analysis based on the available process data. The efficiency analysis serves to transform the pro ce ss data into information on the (loss of) efficiency by representing these data in a comprehensible manner and calculating performance indicators. The interpretation of these figures is based on norm values (determined by the objective and history ofthe packaging line), historical comparison and comparison among packaging lines. Also incidents and exceptions must be taken into . The data should be analysed over different production shift teams, different time periods, different product types, and different packaging lines. From this follows that all analysis can be carried out on a time base, because shift teams, production orders etc. all correspond to certain time intervals. Therefore we assume that the time period to be analysed is specified, for in stance all the shift of the last week of team A, or the time intervaIs of all orders of a certain product, etc. Of each analysis method the following elements are discussed: • Description: description of the method, mostly the idea behind it and the application ofthe method. • Goal: objective ofthe method • Data: which data are used and therefore needed for the method • Calculation: the calculations and graphs ofthe method • Example: example ofthe method • Use: how the method is used and what is the value ofthe method • Remarks: limitations, possibilities and cautions of the method The following analysis methods are discussed: 1. 2. 3. 4. 5. 6. 7.
Efficiency limits and buffer strategy performance Machine event summary and Machine efficiency analysis Accumulation ratefRecovery rate and Buffer efficiency analysis V-graph analysis Statistical analysis: HistogramslFrequency Event lists and Event pattems Efficiency Loss Allocation algorithm
5.1
Efficiency limits and buffer strategy performance
Description The line efficiency is the starting point of the analysis. Theoretically two limits can be derived for the line efficiency. The lower limit is calculated for a hypotheticalline with the same machines and machine efficiencies, however without buffers. In other words a stop on one of the machines causes a stop of the line. The upper limit is calculated for a hypothetical line with the same machines and machine efficiencies, however with infinite buffers. In other words the machines function independently from each other. The lower limit is called the zero-buffer limit, and the upper limit is called the infinite-buffer limit.
33
By comparing the real line efficiency with these lower and upper limits for the line efficiency, a measure for the performance ofthe buffer strategy is derived. The closer the real efficiency is to the lower (upper) limit, the worse (better) the buffer strategy is functioning. In other words if the buffer strategy performs weil the machines function more independently.
Goal This method gives a measure for the performance of the buffer strategy and limits for the line efficiency. Data The data needed for the line efficiency limits are: • line component system, i.e. a description of the machines of the line and where they are connected. • machine efficiencies for all machines (or MTTR's and MTBF's to calculate the machine efficiencies (note that no assumptions are made about the distributions ofthe failure behaviour». The data needed for the buffer strategy performance are: • line efficiency limits • actualline efficiency
Calculation For the lower limit of the line efficiency 77J~n.for a series system without buffers we assume that the production rate of the line is the minimum of the machine capacities of the machines and the line availability is the product of the machine efficiencies. Then the line efficiency lower limit or zero-buffer limit is the product of the line production rate and the line availability [3][4]. Line production rate : R low Line availability
: A
low
= machine min c maeh =
TI
1]machine machine
Lower limit For a system with parallel machines the production rate and availability of each 'production path' have to be summed to get the lower line efficiency limit. For the upper limit ofthe line efficiency 1'/1:. for a series system with infinite buffers we assume that the line efficiency is minimum of the Mean Effective Rates of the different machines. This results in the line efficiency upper limit or infinite-buffer limit. Mean Effective Rate (MERm.ch) = 1'/machin. x C mach Upper limit For parallel machine groups the MER of the group is the sum of the MERs of the machines. And the minimal machine group MER is the upper limit ofthe line efficiency.
34
The buffer strateb'Y performance is defined as the ditTerence between the actual line efficiency 'lhno and the line efficiency lower limit as percentage of the difference between the line efficiency upper limit and the line efficiency lower limit: C'
'C
BUf Ier strateb'Y perlonnance:
IJ =
il
'lljno - 'llinc r
11
X
100"/ /0
11
< . < 'llinc "
'llinc - 'l1111C -
'7lino - '711110
1~~'Wm(Jle
Figure 12 shows the six machines of a (series system) packaging line. The combined Rinser/Filler machine is the co re machine: the buffer upstream of this machine is full and the buffers dO\'lnstream are partly empty.
hgure 12: ('olll(Jonents o/u (Jackuging Ime
In table I the machine capacities as a percentage with respect to the core machine (Rinser/Filler) are shown, and also the machine efficiencies and the Mean Effective Rates for the machines. Muchine
Cmacho/O 135% 100% 100% 125% 130% 135%
Depalletiser Rinser/Filler Pasteuriser LabelIer Packer Palletiser
l1ma~h
97% 98% 99% 95% 93% 96%
MERmach 131% 98% 99% 119% 121% 130%
Tuhle I: Machine cU(Jucit les, mUc/lIne efficlencies (/flJ Meun Ijfect ive Nates
The lower and upper Iimits for the time period specified are shown in table 2; the real efficiency for the period was 87%, the resulting buffer strateb'Y performances is 50%. (/ 0
100% 76%
er limit z
Ruffer .Itrate ' , erfimnance
'llinc
lJlinc
B
76%
98%
50%
'J'uhle 2: I,ower anJ u(J(Jer efficlenr..y liflut wui huffer (Jerfimnunce [Jse Although the Iimits are theoretical, they can serve as a indication of the line potential and the influence of each machine on the line efficiency. The buffer performance should be viewed for different time periods. ft may be possible to estimate a correlation between the line efficiency the machine efficiencies (tor instance always a low line efficiency when the labelIer has a low machine efficiency). The method is used on a very global level
35
Remarks - If we assume that a forced down machine cannot fail (so-called operation depended failures) then the availability of a series system is [3] [4]: A 10w
=
1 1+ L(~"':'", -1) machine
- For a shift the line efficiency can be 0% because of a long failure or because of a changeover faster than planned the efficiency can be over 100%. - The machine with the lowest MER is called the bottleneck of the line; normally this should be the core machine - Reaching (and increasing) the upper limit is likely to be the line objective, and often buffers need not really be infinitely large to achieve this, it should be analysed which buffers (or machines) do not perform in keeping with the upper limit.
5.2
Machine event summary and Machine efficiency analysis
Description The machines of a line are viewed separately using a pie-chart, a summary table of the machine events and the machine efficiency for the analysis period. The pie chart gives the proportion of the time period specified that the machine was in each of the possible states. The summary table gives an impression of the machine behaviour, e.g. exceptions can be detected (e.g. in the maximum state event duration column) and nervous or non-smooth running can be seen (i.e. many short stops). Especially the core machine is of importance, because the production time lost on this machine cannot be recovered (i.e. it results in line efficiency loss). The part ofthe line causing the most core machine stops can be located; this is either the core machine itself (i.e. core machine failures), upstream of the core machine (core machine starvation), or downstream of the core machine (core machine backup). The analysis then focuses to that part ofthe !ine. Goal The machine event summary, pie chart and machine efficiency give a quick overview of the performance of each machine during the period specified, and especially the core machine. Data The data needed for the machine event summary table are: • total time that a machine was in each of its possible machine states, • number of occurrences of each machine state, • minimum, average and maximum event duration for each machine state • standard error ofthe event duration In effect all machine events are needed. The data needed for the machine pie chart are: • total time that a machine was in each of its possible machine states, • time period specified, which ought to be equal to the sum over the total time that the machine was in each of its possible states
36
The data needed for the machine efficiency are: • total time that the machine was running • total time that the machine had an internal failure Calculation The machine data are put in a table with one row for each machine state and column totals at the bottom. On each row the total time of the state, the number of state occurrences, the minimum, average, and maximum event duration of the machine state, and the standard error of the event duration. The pie chart is calculated for the total state times, which add up to the total time of the period specified (otherwise a pie slice 'unknown' is added). The machine efficiency is calculated as defined. Example Figure 13 and table 3 show an example for a Filler for a shift of 8 hours.
Machine: Filler
o Running .Internal Failure IJ Starved for boltles DBlocked by boltles • Lack of material
Figure 13: Time pie-chart machine states Machine state Running Internal Failure Starved for bottles Blocked by bottles Lack of material Total
Sum 6:09 :23 0:22:34 0:29:02 0:51:57 0:07:04 8:00:00
Machine efficiency =
Number # 112 32 27 59 12 242
Mean Min Max S.E. 003:18 0:00:12 0:09:14 0:00: 16 0:0041 0:00:07 0:0343 0:00:15 0:01:05 0:00:53 0:04:02 0:00:24 0:00:53 0:00:23 0:02:19 0:00:19 0:00:35 0:00:19 0:0l:l7 0:00:34 0:01:59 0:00:07 0:09: 14 0:0043
6:09'23 . = 0.942 6:09:23 + 0:22:34
Table 3: Machine event summary tab Ie Use The method focuses on each machine separately using data facts. It gives a overview of the machine registration data. By comparing different shifts changes in the machine behaviour can be detected. Also relations between machine can be analysed by looking at the machine interaction with these machine event summaries (i.e. the number ofbackups compared to the number of machine stops of the next machine). Operators can get information on their machines and the machine behaviour can be compared over different products. Also a need for further analysis can be found .
37
Remarks - extra machine data can be added like the number of units produced, rejects, average speed, MER, etc. - it can also be useful to divide the state running into sub-states for each specified speed, then the number of speed changes gives an impression of the functioning of the machine and the surrounding machines (e.g. are there many speed changes, are all speeds used, and for how long). Also the sum of each total time per machine speed multiplied by the speed should give the number of units produced. Drilling down even further down the failure behaviour and rejects could be identified for each speed.
5.3
Accumulation ratelRecovery rate and Buffer efficiency analysis
Description Although the machines are of course the essential parts of the packaging lines, the conveyors/buffers also have an important task: they allow the machines to function independently. The buffers should cover the short stops or microstops (a few minutes and shorter) and are not designed to cover the langer stops or macrostop (langer than a few minutes). It is assumed that rnicrostops cannot be totally avoided, because of dirt, irregularities in the materiaI, breaking glass, etc. and the high speed of the machines. Macrostops are the result of (Jack of) maintenance or impraper use, they are aften called breakdowns to contrast them with failures. The buffer strategy consists of two parts: the buffers and the overcapacities. In 5.1 the performance of the buffer strategy as a whole was calculated, but also for each buffer separately the performance can be calculated, using the ratio of the accumulation and the Mean Time To Repair. the ratio of the recovery time and the Mean Time Between Failures, and the buffer efficiency [15]. Goal The buffer efficiency analysis, and accumulation and recovery rates give a quick overview ofthe performance of each buffer during the period specified. Data The data needed for the accumulation rate are: • Mean Time Ta Repair (MTTR) for the machine befare the buffer for anti-starve buffers and for the machine after the buffer for anti-block buffers • Nominal accumulation ofthe buffer The data needed for the recovery rate are: • Mean Time Between Failures (MTBF) for the machine before the buffer for antistarve buffers and for the machine after the buffer for anti-block buffers • nominal recovery time of the buffer • Mean Time Ta Repair (MTTR) for the machine before the buffer for anti-starve buffers and for the machine after the buffer for anti-blo ck buffers • actual recovery time of the buffer for a failure of length MTTR The data needed for the buffer efficiency are: • total time that a machine was in each of its possible machine states, for bath the machine before and the machine after the buffer
38
Calculation Both types of buffers: anti-starve and anti-block buffers are treated separately. There is basica!ly no difference between statie and dynamic accumulation here. Anti-starve buffers Let machine A and machine B be the machines before and after the buffer as shown in figure 14, the flow is trom A to B. The core machine is B or one of the following machines. The objective of the buffer between machine A and B is to prevent machine B trom becoming starved. Machine A has an higher machine capacity than machine B to catch up when machine A has had a failure (see figure 6).
Figure 14: Two machines connected by a buffer The accumulation rate is equal to the rate of the accumulation of the buffer and the MTTR of machine A: T nom accumulation rate = M;;R A
accumulation capacity in containers c~om x MTTR A
The accumulation rate is also equal to the maximum buffer content divided by the average decrease of the buffer content by machine B during the average failure time of machine A. For instance, an accumulation rate of 1.5 means that the buffer provides an accumulation of 1.5 times the average failure time of machine A. Obviously the higher the accumulation rate the less influence the failures of machine A have on machine B. The recovery rate is equal to the increase of the buffer content during the average run time of machine A because of the speed difference between machine A and B, divided by the average decrease of the buffer content by machine B during either the nomina! accumulation time or the average failure time of machine A. . MTBFAx (CA - c~om) nam mal recovery rate = nom nom C B X Tacc
mean recovery rate
=
MTBFAx(C A _c~om) nom
CB
xMTTR A
The higher the recovery rate the more failures of machine A will be covered. The recovery rate is a measure for the ability of a machine to catch up its own failures. For instance a recovery rate of 2 means that the average run time of machine A is 2 times as long as the time needed to recover the average stop of machine A. Note that the mean recovery rate is equal to the nominal recovery rate multiplied by the accumulation rate.
39
Because machine A has an higher machine capacity than machine B the following should hold: B
7Jbuffer
=
TA -T B ,top 'larve TA
X
I OOO/C 0
stop
This buffer efficiency is the percentage of the maximum starve time of machine B that is eliminated by the presence of the buffer and the extra capacity of machine A. F or instance a buffer efficiency of 60% means that on average a stop time of one minute on machine A would result in 24 seconds of starve time on machine B, i.e. 36 seconds are covered by the buffer. If there would be no buffer the starve time of machine B would be equal to the stop time of machine A. If the buffer efficiency is negative then either every stop of machine A stops machine B, the buffer itself is causing problems, there is a delay before machine B starts after a stop, or machine B has an higher capacity than machine A. The value of this buffer efficiency can be distorted by macrostops which are longer that the accumulation time of the buffer and therefore cannot be covered by the buffer (for instance a machine failure of an hour will cause a stop of almost an hour on the other machines). Then it is better to use the buffer efficiency for the number of occurrences: AB
7J#
buffer
=
number of stops of machine A - number of times machine B is starved . x 100% number of stops of machIne A
F or instance, a buffer efficiency of 60% means that six out of ten stops on machine A do not result in a stop of machine B, i.e. four out of ten stops of machine A do result in a starvation of machine B. Again only the stops of machine A not caused by machine B should be counted. If there would be no buffer the number of stops of machine A would be equal to the number of times machine Bis starved.
40
Anti-block buffers Let machine A and machine B be the machines before and after the buffer as shown in figure 14, the flow again is trom A to B. Now, however, the core machine is machine A or one of the previous machines. The objective of the buffer between machine A and B is to prevent machine A from becoming blocked. Machine B has an higher machine capacity than machine A, to catch up when machine B has had a failure (see figure 7). The accumulation rate is equal to the rate of the accumulation of the buffer and the MTTR of machine B: accumulation rate =
T nom
accumulation capacity in containers
ace
c~om X
MTTR B
MTTR B
The accumulation rate is equal to the maximum space on the buffer divided by the average increase of the buffer content by machine A during the average failure time of machine B. For instanee, an accumulation rate of 1.5 means that the buffer provides an accumulation of 1.5 times the average failure time of machine B. Obviously the higher the accumulation rate the less influence the failures of machine B has on machine A. The recovery rate is equal to the decrease of the buffer content during the average run time of machine B because of the speed difference between machine A and B, divided by the average increase of the buffer content by machine A during either the nominal accumulation time or the average failure of machine B. . MTBFB X (C B - c ~om) nomlnal recovery rate = cnom nom A X Tacc
mean recovery rate =
MTBFll
X
(C
- c~om)
B c nom x MTTR A
B
The higher the recovery rate the more failures of machine B win be covered. The recovery rate is a measure for the ability of the machine to catch up its own failures. For instance a recovery rate of 2 means that the average run time of machine B is 2 times as long as the time needed to re cover the average stop of machine B.Note that the mean recovery rate is equal to the nominal recovery rate multiplied by the accumulation rate. Because machine B has an higher machine capacity than machine A the following should hold : A < TB Tblock stop
or: total time machine A is blocked :::; total stop time of machine B except starved by machine A = total time intemal failures machine B + total time machine B is blocked + total time machine B is stopped not caused by machine A (e.g. lack ofmaterial, starved for another reason, etc.)
41
In short the total time that machine A is blocked should be less than the total time machine B is not running that can cause machine A to become blocked. If machine A has an higher capacity than machine B than machine A can become blocked by just filling the buffer because of its higher production speed. The difference between the blocked time of machine A and the stop time of machine B is due to the buffer between machine A and B. The (reverse) buffer efficiency ~.:rer is defined as: BA 17buffer
=
Ts!p - T blOC~
X
100%
TB stop
This reverse buffer efficiency is the percentage of the maximum block time of machine A that is elirninated by the presence of the buffer and the extra capacity of machine B. For instance a buffer efficiency of 60% means that on average a stop time of one minute on machine B would result in 24 seconds of block time on machine A, i.e. 36 seconds are covered by the buffer. If there would be no buffer the block time of machine A would be equal to the stop time of machine B. If the buffer efficiency is negative then either every stop of machine B stops machine A, the buffer itself is causing problems, there is a delay before machine A starts after a stop, or machine A has an higher capacity than machine B. The value of this buffer efficiency can be distorted by macrostops which are longer that the accumulation time of the buffer and therefore cannot be covered by the buffer (for instance a machine failure of an hour will cause a stop of almost an hour on the other machines). Then it is better to use the buffer efficiency for the number of occurrences: BA
1]# buffer
=
number of stops of machine B - number of times machine A is blocked x 100% number of stops of machine B
For instance, a buffer efficiency of 60% means that six out of ten stops on machine B do not result in a stop of machine A, i.e. four out of ten stops of machine B do result in a backup of machine A. Again only the stops of machine B not caused by machine A should be counted. If there would be no buffer the number of stops of machine B would be equal to the number of times machine A is blocked.
Use The performance of the buffer is a tooi to determine problems or bottleneck on a packaging line. Buffer with low efficiencies are either very small buffers or are not functioning weil. Again the values of the accumulation rates, recovery rates and buffer efficiency should be monitored over time.
Remarks - more detailed analysis involves correcting these buffer performance indicators by leaving out stops longer that the accumulation time of the buffer. Note that although buffers are not designed to cover these stops, their influence should not be neglected. Likewise changeovers influence the buffer performance.
42
- instead of using the MTBF sometimes the mean time between stops can be used; and the mean time of stop instead of the MTTR. This may give a more complete picture of the machine interference, because starvation and backup can interrupt recovery. - as in queuing theory, where the service rate should be greater than the arrival rate to avoid an 'explosion' ofthe system, it is expected that the recovery rate should be greater than 1 to ensure a stabie packaging process, and also an accumulation rate greater than 1 is preferabie. - a part ofthe starvation and backup is also eliminated by speed reduction ofthe machine that are becoming starved or blocked. - for each buffer the buffer efficiency can be calculated in both directions, although the buffer is of course designed to function in one direction. If an anti-starve (anti-block) buffer has a low (high) normal buffer efficiency and a high (Iow) reverse buffer efficiency, this indicates that the buffer is mostly empty (fulI), which is of course unwanted.
5.4
V-graph analysis
Description The machines on either side of the core machine have extra capacity to restore the accumulation aft er a failure has occurred. And this overcapacity increases for each machine going upstream or downstream from the co re machine. The graph of the machine capacities has a 'V' -shape with the co re machine at the base. The V-graph of a packaging line is basically a graph of the machine capacities in the sequence of the line. The V -graph can be expanded with the Mean Effective Rate of the machine, which gives the effective V-graph (using machine efficiencies). The actual line efficiency can also be shown. A more detailed V-graph shows a bar for each machine and the machine state totals are shown as bar segments of each machine bar. This Vgraph gives a overview of the machine event sumrnary for the machines of the line. The V-graphs can help identify the bottleneck machine, as this is the machine which has many internal failures, and the preceding machine has a lot of block time and the succeeding machine has a lot of starve time. The buffer efficiencies of 5.3 can also be shown in the V-graph. Goal The V-graph creates a line view instead of viewing the machines and buffers separately; this means that machine interaction can be seen on a global level. It also helps to identify the bottleneck machine of the packaging line. Data The data needed to create the V-graph are: • line component system, i.e. a description of the machines of the line and where they are connected. • machine capacities for each machine The date needed to add the effective V-graph are: • Mean Effective Rate (MER) of each machine, or machine efficiency of each machine to calculate the MERs The data needed to add the actualline efficiency is: • Line efficiency for the period specified
43
The date needed to add the machine bars and machine state bar segments are: • tota! time that a machine was in each of its possible machine states, • time period specified, which ought to be equal to the sum over the possible states of the tota! time that the machine was in that state In effect the same data as needed for the machine event summary pie chart. The data needed to add the buffer efficiencies are: • buffer efficiencies for each buffer, although these can be calculated using the machine bar segments Ca/culation Usually both the V-graph of machine capacities and the effective V-graph are shown together as in Figure 15. Mean Effective Rate (MERmach) = 17mac hine x C mach The machine with the lowest M.E.R. is ca!led the bottleneck machine, i.e. the machine with the lowest effective production capacity [11]. In keeping with the design this should be the core machine. The mean effective rate of the bottleneck machine gives the upper limit of the efficiency (see a!so paragraph 5.1). A line for the line efficiency can be added. The bar V-graph (figure 16) has a bar for each machine and for each machine the machine state total times are projected on the machine bar (provided these add up to the total time of period specified, otherwise a bar segment 'unknown' is added). So, each machine state has a bar segment within the machine bar, proportional to the tota! time of the state with respect to the tota! time ofthe period specified. total time of machine state
machine state bar segment
= tota!'time 0 f the peno . d 'fi d x machine capacity specl Ie
The bottleneck machine is then identified as the machine which transforms backup into starvation, i.e. the previous machine is blocked and the next machine is idle, whereas the machine itself has few starvation and backup, but a lot of failures (or loss of speed). Again a line can be added for the line efficiency, the machine state running can then be divided in a part running at nominalline speed and a part loss of speed. Fina!ly the buffer efficiencies can be shown by connected the bar segments of the machine before the buffer with the relevant bar segments of the machine after the buffer, as in figure 17. For anti-starve buffers all stops of the machine before the buffer that could cause starvation are connected with the starvation of the machine after the buffer; for anti-block buffers a!l stops off the machine after the buffer that could cause backup at the machine before the buffer are connected with the block time of the machine before the buffer. Note that the order arrangement of the different machine states bar segments is important. Also the value of the buffer efficiency can be shown in the graph or in a corresponding tabie. Example Three examples of V-graph are shown in figure 15 -17. Figure 15 is a basic V -graph with machine capacities and MER, figure 16 is a bar V-graph with the machine states projected on the bar of the machine capacity and MER, and figure 17 is a bar V-graph with buffer efficiencies.
44
Machine Capacityc------- - ........ Machine capacity
160"10
--+- MER
140% 120% 100% Line efficiency 80%
60"10
=
80%
--- --------- ---- ----+---+---+---+---T---T---~--r_--r_-~
...
~
bO
.,
il ï:'"
~
::l
ii2
<.)
c:: ï: ..c
-;;
ol
....
~ ,.,:,
"'"
c::
;.:;i
~
~
~
c::
... ]
bO
~
p.,
p.,
Vl
Figllre /5: V-graph: muchine CUpucl/le,I, AIU? und Une efficie/1L}'
Machine.-________________________________________________________~ Capacity 160%
~
" Cl
[==::J Running
_
"c::
il
'"
~
.~
ol
:;0" Cl
<.)
E
Starved
[==::J
...
~
~ "'"c::
ii2
Failed _
.,
;.:;i
....
~
bO
il
~
ï:'"::l
.0
ij"
ol
p.,
Bloeked _
bO
c::
<.)
il
'"
.~
:; p.,
~
,.,:,
"2 ..c
Vl
Laek of material --+- MER
Figllre /6: V-graph: purti/io/1 of'nwchine cupuci/ies liver muchine sla/es and AI/éR
45
N.fachme ~
______________________________________________~
Capacity 160%
.,e
;§., :.ë <J Cl os
e
.,....
.~
::;;0.
.,
Cl c::::::J Rtmning _
~
~.,
e
~
Starved c::::::J Failed _
00
~
;§
Ol
::s
.J:J
~
j
Bloeked _
00
e :.>i<J
os (l...
~
]
~
Laek of material
~ ~
.§ ..e
r/J
--+- ME R
I'/gure 17: V-gruph : muchine cupucilies unJ hullà elliciel1C/e.\
(J.\e
The main use of the V-graph is the overview it gives of the machines and buffers of the line . ft is a tooi to detect exceptions and bottlenecks. The V-graph is useful in comparing different packagi ng lines.
Remurks - note that overcapacities are only useful in combination with buffers. - there should be a choice which machines are shown in the V-graph, for instance leave out unimportant machine or machines with so much overcapacity that the whole graph gets out of proportion: or create a separate graph for the carton street and the packing mac hine - for groups of parallel machines, the machines can simply be added together - the V-graph can be even more detailed either by adding a division in failure types (e.g. between microstops and macrostops) or by addi ng a division in different machine speeds (e.g. a bar segment for each machine speed instead of just one segment ' running' or a bar segment for the net production time (=number of units produced/machine capacity) and a residual bar sel:,rment 'Ioss of speed'. - another V-graph shows the different machine speeds of the machines of the line. This can be seen as a part of the line logic. For each machine the speeds as set in the control are marked in the graph. One would expect, for instance, that all machines have a speed almost equal to the nominal line capacity, to allow the line can run in equi librium . - another way of creating a line overview is showing the machine efficiencies and buffer efficiencies in lay-out ofthe line next to each machine and buffer respectively.
46
5.5
Statistical analysis: Histograms
Description The machine events can be analysed statistically is various different ways. This analysis should of course have an aim, and is often triggered by some signalor indication of a characteristic or relation ofthe observed quantities (a so-called conjecture or hypothesis). Statistical analysis is less detailed than an event list, but more detailed than the machine event summary. It can give more insight than either the event list and the machine event summary. All the classical statistical methods can be of use. Here only histograms for the machine state events are discussed. Goal In general statistical analysis is used to confirm of reject conjectures on certain observed quantities. Histogram analysis is used to identify the distribution ofthe machine behaviour i.e. machine event duration. Data The data needed to create an histogram diagram are: • duration of each machine state event, for the machines and machine states being analysed Calculation An histogram is a (bar) graph of the frequency distribution of a certain group of events over certain chosen intervaIs (usually with the same width). First the interval width is chosen (e.g. 20 sec.) then all events are assigned to the interval that contains the duration ofthe event. Often not only the number of events per interval (=frequency) are reported but also the total duration of these events for each interval (pareto diagram). Example An example of an histogram of the failures of a machine is shown in figure 18. The number of occurrences is shown as a line, the total time of the events in each interval is shown as a bar. Also the accumulation of the buffer after the machine is shown. Total time
Numberof occurrences
accumulation
60
15 min
40
10 min
20
5 min
o
20
40
60
80
100 120
140
Figure 18: Histogram ofmachinefailures
47
160 time (sec)
Use Statistical analysis is used to combine the detailed data into some sort of summary, to get an impression of the data. In particular histograms are used to analyse the machine state events. The development and changes in the machine behaviour (and thus the histograms) should be monitored over time. In this way relationships between certain quantities can be established. Remarks - the shape of the failure and run distribution is shown using a histogram, though often for convenience exponential distributions are chosen. Also separate estimates of the MTTR and MTBF (or even the distribution function) can be made for each type of failure. - some examples of the variety of possibilities for statistical analysis are: relationships between product types and machine behaviour or line efficiency, energy use during the different machine states of the pasteuriser, comparison of rejects between glass or carton suppliers, efficiency trends over teams or shifts, influence of changeovers, relationship between rejects and start/stop behaviour of machines or failures, recovery and accumulation, etc. - a histogram can also be used to look at the buffer performance. For instance, if the starve events of the machine before the buffer are put in a histogram and the stop events of the machine after the buffer in another histogram. Again the accumulation can be shown.
5.6
Event list and Event patterns
Description From the machine events a more detailed overview can be given in an event list, sorted by duration or by start time. Also event lists for each machine state separately can be given, or even a detailed failure list with a failure type or cause for each failure. Also time restrictions on the event length can be set. These are all simply database queries resulting in a table of data. Also queries over more than one machine can be given, e.g. comparing two parallel machines, or matching two consecutive machines for backup and starvation. Graphically this can be represented by colour patterns on a time line, one line for each machine. The different machine states all have their own colour. In this way nervous machine behaviour can be detected quickly and if the time-scale is small enough cause and effect relations can be identified between failures and starvation or backup. Also graphs per machine or machine state or combinations of machines and machines states can be generated, or again graphs using time limits. Basically event lists are a tooi to quickly scan the machine event data, and event patterns could be called graphical queries. Goal The event lists and event patters give a detailed overview of the machine events of the period specified for monitoring (e.g. identifying exceptions, detecting cause and effect relations, etc.). Data The data needed for the event lists and event patterns are: • start time and end time of every machine state event, for all the machines ofthe line
48
Calculation Basically the event list is the result of a database query. With aselection for which machines state events should be regarded, per machine which machine states, minimum and maximum event duration, sorted by machine, duration, and/or start time or end time. The event pattems are a graphical representation of these queries. For each selected machine a time line is drawn for the period specified, and each event is shown on this line trom start time till end time with the corresponding colour. Example Figure 19 shows two event lists for a certain machine, sorted by start time and sorted by duration, over a given period. Figure 20 shows an event pattem for three machines. Event list
Machine A
0:00:00 - 8:00:00 all events > 0 min, sorted by start time
State Running Blocked Failed Blocked
Duration 0:03:26 0:04: 13 0:00:04 0:02:14
Start time 0:00:00 0:03:26 0:07:39 0:07:43
Event list
Machine A
0:00:00 - 8:00:00 all failures > 5 min, sorted by duration
State Failed Failed Failed
Duration 0:14:34 0:09:22 0:06: 11
Start time 6:46:00 4:07:48 4:21:27
End time 0:03:26 0:07:39 0:07:43 0:09:57
End time 700:34 4:17:10 4:27:38
Figure 19: Event lists, sorted by start time or duration Machine A
it"41 ti
B
c
----------------------------------------------------+1 time
o
Running
rIl Starved El Failed I!!!l Blocked •
Lack of material
Figure 20: Event pattern ofthree machines Use Event lists and event pattems can be used to get a picture of the functioning of the packaging line over the period specified, a view of the machine interference and an impression ofthe machine failure behaviours or event sequences.
49
Remarks - the usefulness of the event lists and event pattems can be enhanced when data on changeovers, planned downtime, lunch breaks etc. are added. - more detailed lists and pattems distinguish between different types of failures and different machine speeds. - the functioning of a buffer for anti-starve buffers can be shown in detail with an event pattem of the starve events of the machine after the buffer and the stops of the machine before the buffer that can cause starvation at the machine after the buffer; the functioning of a buffer for anti-block buffers can be shown in detail with an event pattem of the block events of the machine before the buffer and the stops of the machine after the buffer that can cause backup at the machine before the buffer. - a better way offollowing the buffer functioning is to combine these event pattem with a graph of the machine speeds of the machine before and after the buffer, and the buffer content for the same period of time (see figure 11).
5.7
Efficiency Loss Allocation algorithm
Description The analysis methods described above all give an impression of the functioning of the packaging line. However one would like to have hard figures instead of pattems and indications. The efficiency loss allocation (ELA) algorithm was developed to achieve this for packaging line 2. The ELA algorithm concentrates on the total loss of production time of the core machine of packaging line 2: the filling machine. As mentioned above, this loss is almost equal to the loss of efficiency. The loss of production time is allocated to the machines of the packaging line.
The algorithm works as follows. For each buffer the fill level is monitored, and if the fill level differs trom than the nominal fillievel the cause(s) of this difference are recorded. This is done in discrete time steps: for all events of the machine before and the machine after the buffer. When loss of production has occurred this is allocated to the causes that have been recorded at that moment. The fill level of a buffer is a function in time. The buffer fill level at a certain moment can be viewed as a bar with a height equal to the number of units in the buffer. If this bar differs trom the nominal height (corresponding with the nominal fill level) the causes are shown in bar segments (figure 21). Buffer fill
Buffer
Cause bar
level
fill
level
Anti-block buffer : Causebar
Nooonru
~----------~-
Nooonru
r-----------~-
Anti-starve buffer
--time
--time
Figure 21: Buffer contents and cause bars for anti-starve and anti-block buffer
50
For an anti-starve buffer all causes of the buffer fill level below the nominal fill level are recorded (as more than nominal is OK); for an anti-block buffer the causes of the buffer till level above the nomina! fill level are recorded (as less than nominal is OK). The soca!led 'cause bar' consists of the bar segments of the causes for the fill level above or below nominal. At the end of each machine event that is relevant for the buffer (i.e. the union of start and end times of the events of the machine before and the machine after the buffer) this cause bar is updated: adding or increasing a cause, rescaling, or emptying the cause bar. The buffer fillievel changes because ofthe differences in speed ofthe machine before and the machine after the buffer: the total change is the integral over time of this speed difference. A loss of production time is allocated to the present causes in the cause bar at the end time of a loss event (i.e. machine stop or machine speed lower than nominai). This ailocation is propagated until the core machine (the filling machine). For in stance the bac1cup of the labelling machine is allocated to the packer and palletiser, then the backup at the pasteuriser caused by the backup of the labelling machine is also ailocated to the packer and palletiser, and again for a backup of the filling machine caused by this backup of the pasteuriser. This is called cause propagation. The total allocation of production loss at the filling machine is listed. The cause bar consists ofthe fillievel ofthe buffer above or below the nominai fill level with a bar segment for each cause. When the fillievel remains between the nominai fillievel and the fillievel at loss of production (machine stop or loss of speed), the cause bar corresponds to the extra or lower fill level. When the machine before or after the buffer gets blocked or starved and the directly responsible cause continues, somehow the cause bar of that cause has to be increased (otherwise the cause would not be weighted fairly'). This is done with a virtual jill level. The bar segment of the cause is then increased (or decreased) with a segment of the extra units that are virtually put on or removed from the buffer during event, equal to the backup of starvation time within the event multiplied by the nominal machine capacity of the stopped machine. The virtuai fill level is then higher than the real fill level. When the fill level decreases (in the case of backup) or increases (in the case of starvation) the virtual fill level is rescaled to the real fillievei. The cause bar segments decrease proportionally. Once the fillievel is equal to the nominal fillievel, the cause bar is c1eared. Failures remain a cause, until the fillievel ofthe buffer is recovered to the nominal fill level. The list of causes is only as long as the number of machines, yet other causes can be added (e.g. start-up, changeover, lunch break, external downtime etc.) The main idea of the algorithm is that the ratio of the causes is constant under rescaiing. This ailows the loss allocation at the end of the events, and is useful in allocating starvation through gaps in the product flow. Note that there is a difference between the fill level of a buffer and the arrangement of the product on the buffer (e.g. gaps in the product flow). The arrangement of the buffers is, signalled by the sensors on the buffers, as far as possible. Implicitly it is assumed that at the nominal fillievel no backup or starvation can occur (as at the nominal fillievel no causes are listed).
For instance, the bar segment of an event that causes the machine to become blocked and continues would otherwise stay constant, with the virtual fill level the segment is proportionally increased with the event duration. In other words otherwise the last event that causes the machine backup would receive a smaller cause weight.
51
I Goal The ELA is used to allocate the totalloss ofproduction time ofthe core machine (i.e. the filling machine for packaging line 2) over the period specified, to the machines of the packaging line by monitoring the buffer fill levels. This results in a table of the loss of production time caused byeach machine or a pie chart of the totalloss of production time with a pie part for each machine (this is called a Fil/er Loss Analysis [19]). By knowing how much production loss each machine causes, the bottleneck of the line can be identified and effort and further analysis can be directed to that machine(s) to improve the line efficiency. Data The data needed to run the ELA-algorithm are: Static data • for each buffer: the maximum fillievel, and the nominal fillievel, • if available: the fillievels at backup, starvation, change of speed of machine before and after the buffer • for each machine: the machine speeds as set in the control, and the nomina! capacity Dynamic data • current machine speeds • buffer fill level of the buffer before and the buffer after the machine at each machine event
Calculation The steps ofthe ELA-algorithm are described below: STEP 0:
INITIALISATION
Start with: • all buffer empty, then for the buffers before the filler the cause ofthe lack is 'start-up' and for the buffers after the filler no cause is needed, or • all buffer at their nominal fillievel, or • all buffers at the current fill level, then the cause for lack or extra fill level is ' initialisation' . STEP I :
MONITORING THE FILL LEVEL
The fill level of the buffers is monitored all moments relevant for the buffer and causes are recorded in a list for each buffer. Time Let B be a buffer en MI the machine before Band M2 the machine after B. The machine state events of MI and M2 are relevant for B. Let Tij be the end time of event i on machine MI with i=I,2,3, ... (this is also the start time of event i+ 1); let T2j be the end time of event j on machine M2 with j=I,2,3, ... (this is also the start time of event j+ I). Then let Sk be the time of moment k relevant for B, with k=I ,2,3, ... with Sk= min { (minj (Ti j ITij > Sk-l), (minj (T2j IT2j > Sk-l) }where So=Tl o=T2 o=0, i.e. the start time ofthe period specified.
52
Production rates: vl(t) = speed machine mI op at time t v2(t) = speed machine rn2 op at time t vl nom = nominal speed machine mI at time t v2nom = nominal speed machine m2 at time t FilI level: FLB(t) = fillievel of buffer B at time t [in units], this can be measured, otherwise: Sk FLB(Sk) = FLB(Sk-l) + f {vlet) -v2(t)} dt '" VGB(Sk-l) + {VI(Sk_l) -V2(Sk_l)} x {Sk - Sk-J} Sk-l nom FL B= nominal fin level of buffer B, lower bound (upper bound) ofnominal fin level interval for anti-starve (anti-block) buffer of a chosen value FLminB = minimal fin level of buffer B, i.e. at this fin level production loss starts FLmaxB= maxima! fillievel of buffer B, i.e. at this fillievel production loss starts VFLB(t) = virtual fiJl level of buffer B at time t [help variabie] = the true fin level plus the extra fiJl level for continuing causes Causes: For the machines a list is kept ofthe causes: Om(Sk) = cause contribution of machine m for the fiJl level ofthe buffer other than nominal Om>Ofor an anti-block buffer and Om
{FLB(Sk_l) - FLnomB}1",,0 b) list is not empty and FLB(Sk) > FLB(Sk-l) for an anti-starve buffer, for every machine m on the list: Om(Sk) = a· Om(Sk-l) with a ={FLB(Sk)- FLnomB} / nom {FLB(Sk-l) - FL B}1",,0
4. a) FLB(Sk-l)= FLmaxBand the event that led to the backup continues, then increase this
cause with Om(Sk)+=(Sk-Sk-l) x vinom, and caIculate the virtual fillievel: VFLB(Sk)= FLmaxB +Om( Sk) b) FLB(Sk-l)= FLminB and then event that led to the starvation continues, then decrease this cause with Ûm(Sk)~(Sk-Sk-l) X v2 nom , and caIculate the virtual fiJl level: VFLB(Sk)= FLmaxB -Om(Sk) 53
5. a) ifFLB(sk) < FLmaxB and VFLB(Sk) > FLB(Sk) then scale the causes by a factor a={FLB(sk)-FLnomB} / {VFLB(Sk) - FLnomB}Ia;,Q b) ifFLB(sk) > FLminBand VFLB(Sk) < FLB(Sk) then scale the causes by a factor a={FLB(Sk)-FLoomB} / {VFLB(Sk) - FLnomBHuo So, at each time Sk the list of causes is known (or empty) IfFLB(sk)= FLmaxBor FLB(Sk)= FLminBand recovery starts then allocate the loss to the causes: STEP 2, else STEP 1. STEP 2:
LOSS ALLOCATION
Production loss is allocated to the causes at the end ofthe production loss event. Allocation: A list is kept ofthe totalloss a machine has causes: Smet) = totalloss allocated to machine m at time t, Sm(O) =0 Allocation: For all causes in the relevant list at time Sk increase the allocation for back-up and decrease the allocation for starvation:
with:
production loss
= Vnom x (ti - ti-I) machine stop + (Vnom - V(ti_I) X(ti - ti-I) loss of speed before stop + (Voorn - V(ti+I»X (ti+1 - ti) loss of speed after stop
So, the production loss is allocated to the causes in the list at the end ofthe loss event. Example
The ELA-algorithm results in a c1ear and useful table (tabie 4) or pie chart (figure 22) of the production loss.
Machine
Depalletiser RinserlFiller Pasteuriser Labelling Packing Carton street Palletiser Total
Production loss (min) 9
18 I 10
4 6 2 50
%
18% 36% 2% 20% 8% 12% 4% 100%
Table 4: Output table ELA algorithm
54
[i]
• Carton sireei 12%
Packing 8%
• Palleliser
4%
ll1 Labelling 20%
• Depalletiser 18%
C Pasleuriser 2%
o
Rinser/Filier 36%
Figure 22: Output pie-chart ELA-algorithm
Use The ELA algorithm is both useful from a more theoretical point of view, for instance in simulation studies when all parameters can be controlled, and useful from a practical point of view, i.e. if the resulting table and/or pie chart are available every shift. The loss allocation gives on overview of the influence of each machine on the line efficiency. The influence of changes in machine behaviour can be expressed in hard figures. It improves the experience based estimates that are being made about the causes of efficiency loss. Remarks - The algorithm is very logica!: using the buffer contents to track the causes of efficiency loss seems obvious, and all the dynamic data that is needed can be collected. However, the nominal fillievel plays an important role is not easy to determine, and also the cause weight created using the virtual fill level is not totally apparent. Also for packaging lines with parallel components the algorithm has to be adapted - in the algorithm the nominal speed is used, because the loss of production is with respect to the filler and the real speed at which the machine would have run at is very hard to determine. - the resulting table is called an Filler Loss Analysis [19] tabie, using buffer efficiencies an approximation of this table can be calculated·. Allocating the 10ss of production time of all machines ofthe line would result in a so-called Lost Time Matrix [23] - when the cause bar segments are recorded as percentages of the total cause, the virtual fillievel is not necessary but the segments are rescaled accordingly. - the algorithm depends on the nominal fill levels of the buffers. Therefore a sensitivity analysis for these values can be made, by simply choosing and comparing different values for the nominal fill level while using the same data. - visualisation ofthe calculations ofthe algorithm can give insight (for instance the buffer contents, the cause bars, the loss allocation, etc.) • For instance first multiply the tota! stop time of the labelIer with the buffer efficiency of the buffer between the pasteuriser and the labelIer and then multiply tbis with the buffer efficiency of the buffer between the filler and the pasteuriser to get the approximation of the efficiency loss cause by the labelIer.
55
CHAPTER 6
SIMULATION
This chapter compares analytical and simulation models and discusses the possibilities of using simulation to analyse the efficiency ofpackaging lines.
6.1
Mathematical models
A model is a representation of the operation of the system. To the of a model, it either is a mathematical formula or a computer program which, when supplied with the numerical values of various parameters, will make a numeri cal prediction of the system performance measures. By changing the values of a parameter the can gain insight into its influence on the system performance. The model may even enable the optimal values of the parameters to be found (where optimal means that they optimise the performance ofthe system as described by the model). Models are intended to decisions about the system, so there rarely is one model that will all decisions. The basic approach to modelling [5] involves the following steps:
1. Identify the issues to be addressed: ascertain the needs of the : what is the problem? how will the model be used? when is it needed? 2. Learn about the system: identify the performance measures of interest to the , characterise the relevant aspects ofthe components and key parameters ofthe system. 3. Choose a modelling approach: use simulation or analytical modeis, do models already exist? 4. Develop and test the model: obtain data on the parameters of the model, make 'reasonabie' assumptions. 5. and valiciate the model: check the model for internal consistency (verification), and assess the accuracy ofthe results (validation). 6. Develop a model interface for [he : ensure that the can actually use the model and convince the of the value of the model. 7. Experiment with the model: develop an understanding of the factors influencing the performance ofthe system. 8. Present the results: give recommendations based on the model results, explain the possibilities and limitations of the model, promote the model. There are two types of mathematical modeis: simulation models and analytical models. Simulation models represent the events that could occur as the system operates by a sequence of steps in a computer program. The logical relationships that exist between events must be known. The probabilistic nature of many events, such as machine failures, are represented by sampling from a distribution representing the pattern of occurrence of the event. Simulation studies are time consuming but can handle even very complex system modeis. Analytical models describe the system using mathematical relationships. These are used to derive a formula or procedure by which the performance measures of the system can be calculated. This type of model often relies on the presence of an elegant mathematical structure. Analytical models are easy to use and provide insights into what determines the system behaviour. However, often further assumptions have to be made with respect to the relationships of the model. This resulting model is then approximate rather than exact.
I
111 kM 1_1 'i kl I
57
In developing a model there are a number of considerations: • complexity versus simplicity: decide how much data to represent; more detail is likely to better resembie the reality, yet requires more time and is harder to and validate. On the other hand a simple model may not represent the system adequately. Simulation models can be used for whatever level of complexity is desired. Analytical modeIs are quite limited in the complexity of the system they can describe, and although approximate models can handle larger systems, these models are difficult to . • flexibility: both the system and the decision making about the system evolve over time, this means that the model should permit changes in the system modelled (ranging from changes of the parameter values to changes of the system structure). For both simulation models and analytical models it is easy to change the parameter values. Simulation models can often be easily adapted to analyse related system structures, whereas changes in the system structure often require a totally new analytic model. • data requirements: in general the data mainly determine the value of the model, often the data available is not in the form required by the model, the data collection, applicability of the data, sensitivity assessment of the model to errors in the data are important aspects. Most analytical modeIs require far less data than simulation modeis. • transparency: in order for the model to be accepted by the s, the model assumptions and procedures must be reasonably transparent to others beside the model developer(s), this often requires understandable documentation. Simulation models are often written in specially developed simulation code, which is only transparent to a prograrnmer. However, the logic of the simulation model can be described to the . Analytical models are usually transparent to those who have the appropriate mathematical skilIs. • efficiency: models can consume significant resources, both in their development and in their use. The effort required to develop a simulation model is more predictabie than the effort needed to arrive at an analytical model. Analytical models generally do not require much time to use to get results. Simulation models require substantial time, especially when changes in parameter values are to be explored. • interface: a interface is essential to enable correct use of the model, both with respect to the required input and the interpretation of the results. Simulation modeIs often have a visual and interactive interface, which shows an animation• of the operation of the system. This can be very valuable both in developing and using the model. The interface of analytical model is mostly restricted to input and output screens. Effective modelling of systems often require both analytical and simulation models. Analytical approximations are often tested with simulation modeis, and simulation models are validated by looking at extreme cases, where the system performance can be easily predicted with analytical models (for instance when it is assumed that machines never fail) . As mentioned in paragraph 5.1, analytical models exist for the extreme cases of packaging lines without buffers and packaging line with infinite buffers.
• Simulation and animation can also be used in training operators
58
6.2
Packagiog lioe models
To analyse the efficiency of packaging lines both simulation and analytical model can be used . 6.2.1
Analytical models
Due to the complexity of packaging lines analytical modeIs are rare. The complexity is caused by the relatively large number of machines of a packaging line and the presence of buffers. The functioning of these buffers generates the probabilistic interference of the machines, each having their own capacities, speeds and failure behaviour. Also the characteristics of a packaging lines like the V-graph machine capacities, and the transport function of conveyors/buffers are usually hard to incorporate into these modeis. In the literature of manufacturing systems like flow lines and automatic transfer lines only exact models for two machines are to be found. For modeIs of three or more machines only some scarcely applicable approximations are known, because many extra assumptions have to be made. However, the general idea behind some of these analytical models or procedures can be helpfuI. For instance from the point of view of a buffer the line consists of just two machines. Also integrating several machines into one is an effective simplification [9]. If exponential distributions for the failure behaviour of the machines are assumed, markov chain models can be formulated for these manufacturing systems, yet the number of states is too large' to solve the model [4]. 6.2.2 Simulation models Simulation of packaging lines can be performed on several detail levels, ranging from global and simplified simulation models to simulation models that consider the forces exercised on each bottle. Simulation is often used when the problem or model definition is too complex to be solved by an analytic method. Appendix C presents a simp Ie simulation model that was used to estimate the expected line efficiency of packaging line 2. This model only takes into the machine capacities, the buffer capacities and the MTTR and MTBF of the machines. Simulation represents the movement of bottles, cans, cases, pallets or people through a set of relationships. These pieces are referred to as the entities of the system. There are basically two types of simulation: discrete event and continuous simulation. These relate to how the entities move through the system. Discrete event simulation occurs when the dependent system variables change discretely at specified points in simulated time, referred to as ' event times' . For in stance, modelling the arrival of beer bottles at a filler is a discrete event simulation because there is aspecific event when each bottIe reaches the filler and the model is updated at the time of each of these events. In a continuous simulation model, the state of the system is represented by dependent variables that change continuously over time. For instance, the transfer of beer from one tank to another is a continuous process and is modelled as a continuous function over time. Simulation of packaging lines to analyse the line efficiency involves discrete event simulation ofthe production units ofthe packaging line. The nurnber of states of a markov chain model is determined by the nurnber of states of each machines (ruruting, failed, etc.) and the nurnber ofstates ofeach buffer (the nurnber of units in the buffer, ranging from zero to a few thousand) . For a simplified version of one street of packaging line 2 consisting of 6 machines and 5 buffers the nurnber of states is already of the order 1020 .
59
The advantages of simulation are: • understanding and learning: the construction and use of a simulation model will provide understanding of the operation of the entire packaging line system; also the influence of the line parameters is leamed • timing: new policies and procedures can be tested on the model before use on the real system, or a new machine can be evaluated for its applicability and its effect on the rest of the packaging line before it is even ordered • troubleshooting: process bottlenecks, often not readily obvious, of the packaging line can be identified • experimentation: new situations and solutions can be tried without risk, i.e. without the costs of actually implementing the proposed change, and without disturbing the real packaging line The disadvantages of simulation are: • specialised skilIs: there is need for specialised skilIs to analyse the problem and build the modeis; these skilIs involve knowledge of probability theory, statistics and programrning or the simulation software' • interpretation: simulations deal with random data and thus the output must be interpreted with care; for instance confidence intervals should be constructed and sufticient simulation runs should be generated • costs: simulation is time consuming; the benefits form the simulation should cover the costs to construct and exercise the model; note that the costs of simulation decreases as more simulation models are built, i.e. as experience increases To ensure the success of a simulation study there are three necessary conditions: • there must be a stakeholder who knows what the target problem is, and can determine what will constitute a solution to the problem. This person or group must be in a position to assign resources for the analysis ofthe problem and the development ofthe simulation model. Also they must have the capability ofimplementing the resuIts ofthe simulation. This condition is often called management commitment. • there must be the resources for analysis of the input data to the system model. This is a time consuming and time sensitive task, because the data must be fresh and relevant for the model to have any validity • there must be the expertise to construct and exercise the model, and provide analysis of the output of the model in the form of recommendations for the stakeholder
• Specialised simulation software developed for packaging Iines is available, e.g. Pritsker Packaging Lines ® [12)
60
Simulation modelling process The simulation modelling process involves the following steps:
6.2.3
l. Problemformulation: Defining the problem solving objective 2. Model building: Abstracting the system into mathematica1Jlogical relationships in accordance with the problem formulation and preparing a computer model 3. Data acquisition: Identifying, specifying and collecting data 4. Verification: Establishing that the computer model executes as intended 5. Validation: Establishing that a desired accuracy or correspondence exists between the simulation model and the real system 6. Experimentation: Executing the simulation model to obtain output values 7. Analysis of results: Analysing the simulation outputs to draw inferences and make recommendations for problem resolution 8. Documentation: Detailed description ofthe model and its use Step 1 and 2 lead to a c1ear problem and model definition, which ensures that only the relevant aspects ofthe system are modelled . Step 3 is often difficult and time consuming, although with the introduction of Line Monitor Systems (see also chapter 4) more and better data becomes available. Using sensitivity analysis (or what-ifanalysis) the influence of errors in the data and the assumptions that were made, can be determined. Step 4 and 5 check the applicability of the model. Step 6 and 7 involves the design of experiments and the interpretations of the results. Step 8, finally, secures the knowledge that was obtained and enables reusability ofthe model and methods. Simulation models can be developed in a number of ways. One is to try and include all the required detail of the system trom the beginning. This tends to result in long development and debugging time and usually makes the resulting code unreadable to all but the developer. Another approach is to develop models of system components and, after each component model has been debugged, tested and validated, link the components two at a time, test and validate, then three at a time, test and validate, and so on. Ideally this results in a library of simulation models of various components and subsystems, and of various detail level. This approach is called the micro-macro approach and is useful in developing models of large systems and especially valuable in of reusability. In order to evaluate the simulation results of a complex system like a packaging line tools to analyse the results/data are needed, i.e. methods to determine the influence of parameters. Suitable tools are the efficiency analysis methods as described in chapter 5. Of course, in simulation studies the parameter values can be controlled and varied and thus more insight can be obtained. However data analysis of the process data of existing packaging lines is a essential step before simulation models are constructed. The ultimate model validation is to use the individual machine events of a packaging line (as recorded by the Line Monitor System), and the actual control of the line (as programmed in the PLes of the line equipment) as input for the simulation model and compare the system resuIts with the real resuIts. Simulation is particularly useful when the packaging line is just being designed, when changes and improvements can be made easily and quickly. After the packaging line has been installed, it is of course much more difficult to alter the system features.
61
lil IIIIK
i
6.2.4 Packagiog lioe simulatioo use Simulation is a valuable tooi for efficiency analysis of packaging lines and can be used to answer the following questions about packaging lines: • Should a certain machine with a machine efficiency of 87% be replaced by another machine with a machine efficiency of 98%? • What would happen if the maximum speed of a certain machine would be increased by 1O%? Or decreased? • Which buffer capacities should be increased to improve the line efficiency? • Should the conveyor speed of a buffer be changed? • What is the expected optimalorder sequence to produce a certain set of orders? • Do the benefits of stopping a certain machine every two hours for cleaning and inspection cover the loss of production time during the stops? • How do two or more design alternatives compare? • Should we use two or three parallel machines for a certain stage in the packaging process? • What would happen ifthe control ofa certain conveyor or machine was changed? • How much should a certain machine be improved (e.g. increase MTBF, or decrease MTTR) to improve the line efficiency? • What is the influence ofthe value of certain line parameters on the line efficiency?" • What is the maximum or expected productivity of a certain packaging line? • What is the effect oflunch breaks on efficiency? • etc. Simulation is a powerful tooi to analyse complex modeis, when analytical modeIs cannot supply the solution. Although process data analysis of packaging lines is indispensable for process control and often leads to improvements of the line efficiency, many questions can only be answered using simulation. Short term simulation involves creating quick and less detailed models that can be used to get a quick impression, e.g. to upgrade a packaging line. Long term simulation involves creating a simulation model during the design of the packaging line, and using this model throughout the life ofthe line .
• Perturbation analysis may be a useful method to enhance the value of simulation studies
62
CHAPTER
7
RESULTS
Thts chapter brtefly descrtbes the results of tmplementing the efficiencyanalysis on packaging line 2. On packaging line 2 a pilot system was implemented for the process registration and efficiency analysis ofline 2. This pilot project was called RVC2 ('RendementsVerklaring Colonne 2'). It involved PLC-programming, visualisation, spreadsheet calculations and database applications. First the line logic of packaging line 2 was constructed [16]. This formed the base for the basis registration [24]. The statie data were mostly measured and collected manually. And the dynamic data events were colleeted and visualised on the Line Monitor System and stored in a database. These data were analysed using spreadsheets and also a database application was built. This application featured most of the analysis methods described in chapter 5. Overall this first phase required more effort than expected, because some technical problems had to be mastered. Especially the PLC reprogramming required a lot of time. But also creating a stabie data collection process proved to be difficult. It was a deiiberate choice to keep the first phase simpie. Thus only the machine states were recorded and for in stance no causes were recorded for the machine failures. Although future expansion were considered in the implementation, the goal was to create a bounded but functioning system. The efficiency analysis with this pilot system led to some small improvements. It was noted that the infeed of some machines was not optimal, because there were many very short lack of input events on these machines. Also it was found that one machine had many short failures . On the who Ie the opinion was formed that short failures (Iess than one minute) may have a big influence on the line efficiency, whereas previously the focus was on long failures only. Also suppliers of machines were informed about the performance of their machines. Next the data collection was expanded to enable the implementation of the ELA algorithm. This algorithm was only partly implemented, just far enough to prove that the ELA algorithm works. The Visual Basic application is called Revecon2 [24]. Also the visualisation was expanded with figures of machine speeds and buffer contents (figure 11). These showed a very volatile behaviour of some of the machines. Studying the line logic around these machines, some inconsistencies in the control were found. After these flaws were corrected, a more smooth production resulted. Finally the data collections was also used for a study of the energy use of the pasteuriser, a simple simulation study of line 2 (see appendix C) and a more detailed simulation study. Also many questions were directed to the project team, for instance about data collection for machine acceptance tests, data on the difference in machine behaviour between boxes with six-packs, and boxes with an interior partition, losses of packaging material, machine speeds, etc. The technical aspect ofthe RVC2 project are described in [16] and [24].
63
I The results of the project are of course the definitions and the mathematical methods of the framework for efficiency analysis. This gives insight of what data is to be collected, and what can and should be done with data. This knowledge can be useful in installing or improving Line Monitor Systems on other packaging lines, and a!so help improve the efficiency of these packaging lines. Some improvements were made on packaging line 2 with the help of the pilot system. Especially signals/symptoms/patterns that are not usually noticed were helpfui, because longer periods (hours, days) can be viewedlscanned and analysed in rninutes. Short stops of only a few seconds are normally not recorded but form a large part of the tota! number of stops. Also the line logic and the trends ofthe machine speeds and buffer contents have proved to be usefill. Unfortunately the efficiency ana!ysis is not yet performed on a regular basis. Also the combination of automatic and manual data has not been achieved. However, it was found that there certainly is a need for data, are rather a need for tools to transform this data into information. The framework for efficiency analysis as described in this report and implemented on packaging line 2 is a step in the right direction.
64
CHAPTER
8
CONCLUSIONS
This report presents a framework for the efficiency analysis of packaging lines. To improve the efficiency of packaging lines information is needed. The frarnework describes how this information can be gathered from the process data. Data gathering is not a goal by itself, but should and improve the process control and decision making on packaging lines. Technically there are few limitations for data registration of the packaging process. However, the data registration system should be built with a vision or an expectation of the use of the data and a functional specification of the possibilities and features of the information system. In this respect much can be learned from the history and use of existing information systems, for instance the benefits, problems, errors of the system, etc. In general, the information system must be based on a weil thought-out data model and a set of sound definitions. The line logic provides the definitions of the machine and buffer states and thus forms a base for the data collection. It is probably best to built an information system stepwise, i.e. start with a basis registration and expand it step by step. For each step this results in a functioning system, and also some sort of cost/benefit decision can be made for each expansion. Visualisation is also an important part ofthe system, because it makes the data readily accessible. Data analysis of the process data should not be time consuming but ed by easy to use tools. This means that the information system should have data analysis tools. Data acquisition has no value without knowing what can and must be done with the data (i.e. data analysis). On the other hand, data analysis has no value if it is not based on good process data. The framework presented in this report is the missing link to transform the process data into useful information for efficiency analysis. This is achieved by constructing comprehensible graphs and calculating easy to use performance indicators for the machines and buffers separately, and for the line as a whoie. Simulation can also be a valuable tooi for efficiency analysis, because simulation can help answer a range of questions that cannot be answered using data analysis. However, simulation should always be preceded by data analysis, not only because the collected data forms the input of the model, but also because data analysis can lead to valuable insights that are easier to achieve and more directly applicable. In simulation studies the level of detail should gradually be increased, depending of course on how much detail is required. The success of efficiency analysis depends on the ease with which it can be performed, this means that tools should be available and standard reports should be generated quickly. Next to the technical implementation, also the organisational implementation is a crucial factor for the success of efficiency analysis. This entails training, maintenance of the information system and of the system environment, and making efficiency analysis an integrated task ofthose involved with the packaging line. Especially the machine operators should be directly involved in the efficiency analysis. They probably have the most time to perform efficiency analysis, but lack the skills. Therefore the data analyst should them in developing these skills and in creating the tools that facilitate the analysis.
65
Although, there is definitely much interest for the analysis of process data, it is not obvious which actions can and should be taken as aresuit. Yet, it is expected that by collecting and comparing information on the different packaging lines, efficiency analysis can be a powerful tooi in helping Heineken to achieve its objective of cost leadership. Because of this interest and potential for efficiency analysis, fluther research on and implementation of efficiency analysis systems is needed, in which both the technical and organisational aspects must be considered. The emphasis should be on using information systems and actually performing efficiency analysis, in other words: learning byusing.
66
REFERENCES Most of the references listed here are on the subject of stochastic modelling and queuing theory and in particular on the application of these subjects on packaging lines. Other references are on the subject of simulation, information technology and packaging line definitions. 1. Borkmann, K. and Pannasch, K. (1980), Untersuchungen zur Leistungssteigerung von
Getränkeabfollinien durch richtige Dimensionierung der Transportsysteme und Speicher, Lebensmittelindustrie 27 H. 12, 557-563. 2. Brewery Comparison System, Definitions, 1992 3. Buzacott, J.A. (1967), Automatic transfer lines with buffer stocks, IntJ.Prod.Res. 1967,5 (3), 183-200. 4. Buzacott, J.A. (1971), The role of inventory banks in flow-line production systems, IntJ.Prod.Res. 1971 ,9 (5), 425-436. 5. Buzacott, J.A. and Shanthikumar, 1. George (1991), Stochastic Models of Manufacturing
Systems, 1991 6. Cooke, R.M. (1995), Unicorn: Methods and code for Uncertainty Analysis, Delft University of technology, published by AEA Technology for the European Safety and Reliability Association, March 1995. 7. Cooke, R.M. (1996), The design of reliability data bases, part l: review of standard design concepts, Reliability Engineering and System Safety 1996, 51,137-146 8. Cooke, R.M. (1996), The design of reliability data bases, part l/: competing risk and data compression, Reliability Engineering and System Safety 1996, 51 , 209-223 9. Dallery, Y. and Gershwin, S.B. (1992), Manufacturingflow line systems: a review ofmodels and analytical results, Queueing Systems 12, 3-94. 1O.DIN 8782 (1984), Begriffe flr Abfollanlagen und einzelne Aggregate, May 1984.
I 1. Downes, B.R. (1993), An approach to reviewing packaging line performance and design standards, IOBC & SA 1993, 233-246. 12.Duket, S.D., and Pristker, A., Simulating Production Systems, Pritsker & Associates, Inc. 13.Elsayed, E.A. and Turley, R.E. (1980), Reliability analysis ofproduction systems with buffer storage, Int.J.Prod.Res 1980 (5), 637-645. 14.Gregoire, P.H.A. (1996), Visit Report Fredericia Brewery Denmark, December 1996. 15.Haines, G. (1995), The design and layout of packaging lines, The Brewer, March 1995,9297.
67
16.IJssel, J. van den (1997), Rendementsverklaring colonne 2, TH Rijswijk, January 1997 17.Knudsen, J.W. (1995), High level information technology in bottling, EBC Congress 1995, 457-466. 18.Master Brewers Association ofthe Americas (1996), General Principles for Packaging Line Design and Control, March 1996. 19.Manning, H. (1985), Computer simulation ofpackaging lines, Modem Brewery Age, August 12 1985 . 20.McKenney, J.L. (1994), Waves of Change: Business Evolution through Information Technology, Harvard Business School Press 1994. 2 I. Muth, J. and White, J.A. (1979), Conveyor theory: a survey, AllE Transactions 11 (4), December 1979,270-277. 22.Panwalker, S.S. and Smith, M.L. (1979), A predictive equation for average output of K stage series systems with finite interstage queues, AllE Transactions 11 (2), June 1979, 136-139. 23.Rice, J. (1995), Picture a better packaging line, Food Processing, July 1995, 73 . 24.Schakel, V. (1997), Rendementsverklaring Colonne 2: Revecon2 - applicatie, January 1997. 25.VP-IN (1996), DoelInformatiseringsprojekt Verpakken Zoeterwoude, August 1996 26.Wijngaard, J. (1979), The effect ofinterstage buffer storage on the output oftwo unreliable production units in series, with different production rates, AllE Transactions II (I), March 1979, 42-47. 27.Wolff, RW. (1989), Stochastic Modelling and the theory of Queues, 1989. 28.Yokoi, T. (1992), Deg higher productivity packaging lines, BDI October 1992, 34-38.
68
!- - - -- -
SUMMARY This report presents a framework for the efficiency analysis of packaging lines. The framework consists of a set of clear definitions and the description of various mathematical methods to create comprehensible graphs and easy to use performance indicators. The developments in information technology enable the installation of so-called line monitor systems on packaging lines. Technically these systems can collect almost every piece of data of these lines. In this report this data acquisition process is briefly discussed. It is emphasised that data collection is not a goal by itself, but should and improve the process control of the packaging lines. The control of packaging line equipment can be described using the line logic. At Heineken a lot of data is collected on some of the packaging lines, but unfortunately at present this data is not being used. This is simply because the appropriate tools to analyse the data are not available. The framework presented in this report provides the missing link to transform the process data into useful information. This is done by constructing comprehensible graphs and calculating easy to use performance indicators for the machines and buffers separately, and for the packaging line as a whoie. The ultimate efficiency analysis tooi is the so-called Efficiency Loss Allocation algorithm, which allocates the efficiency loss to the machines of a packaging line. U sing this algorithm the bottleneck machine of the line can be identified directly. The efficiency analysis tools described in this report have been implemented in a pilot system on packaging line 2 of the Heineken Brewery in Zoeterwoude. This system has helped in improving the efficiency of this line. The value of line monitor systems is determined by the tools and features the system offers. Therefore the efficiency analysis tools of this report should be incorporated in new and existing line monitor systems. Efficiency analysis of packaging lines can thus be made easier, more familiar and comparabie, and become an integrated task ofthe s of those involved with the packaging line. Another valuable tooi for efficiency analysis is simulation. The possibilities of simulation are discussed and a simp Ie example of a simulation study of packaging line 2 is given. Simulation uses the process data collected by the line monitor system. For the analysis of simulation results the same efficiency analysis tools should be applied as for the actual process data of packaging lines.
69
I
L
2
C
ol
I1 ,
ApPENDIX A: LINE LOGIC The line logic is a description of the conditions of the states of the machine of a packaging line. It can be presented as a figure of each machine and its surrounding conveyors and a logical table of the state conditions or the state conditions are depicted. Basically it is a description ofthe control ofthe machines by the signaIs ofthe sensors on the preceding and succeeding conveyors. It is an important tooI that gives insight into how the machines of a packaging line react on the population of product on the buffer. Collecting the data for the line logic can lead to changing the control of the machine, because the control is not optimaI. For the operator it is also useful to know the line logic of the machines of his working area. The definition of the states of the machines in the line logic is the definition of registration of the machine states by the line monitor system. (see also [16])
Example Figure 23 shows an example ofthe line logic ofa certain machine. The sensors SI, S2, ... , S6 are used to control the speed of the machine. The sensor signals are: 'free' and 'not tree'. The speed conditions are given in three ways: textual description, summary tabie, and using figures (figure 24).
MachineM
Figure 23: Line logic machine M Text Machine M can be in one of the following 5 states: • High speed, if S 1 and S2 are not tree for 15 sec. and not starved or blocked • Normal speed, ifnot blocked, starved, high speed or low speed. • Low speed, if S2 is 20 sec. free and not starved or blocked. • Blocked, if S4 is not tree • Starved, if S3 is tree Table Sensor Time High speed
S2 free 20sec
S3 free
SJ not free J5sec
S4 not free
Normalspeed'~~@illû2Mlliill&illEillE~ill&ill&illEl Low speed Blocked Starved • Nonnal speed is the machine state if no other machine state conditions are satisfied
71
Graphical
o
= free
kt l = free or not free
_
=notfree
High speed
Low speed
Blocked
Starved
Normal Speed
Figure 24: Graphical state representation The advantage of the graphical method is that possible state transitions can easily be seen; the disadvantage is of course that the time restrictions of the state conditions are less
dear.
72
ApPENDIX B: BASIS REGISTRATION Technically almost everything can be recorded. But the question is what is done with this data, or why the data should be collected. The data acquisition or information system should be tlexible and configurabIe, have a consistent and fiiendly graphical interface (GUl), be stepwise expandable and based on clear definitions. The basis registration is the specification of the first step of the data acquisition as implemented on packaging line 2. It gives an impression of the data that should be collected as a first step for the efficiency analysis ofpackaging lines (see also [24]).
Statie data The following static data must be collected after each change and checked every month: • machine capacities (for each product type) • machine state definitions as determined in the line logic Dynamie data The following dynarnic data must be collected when the packaging line is used for production: • start and end time of every machine state event: running, failure, starved, blocked, not in use; for blocked and starved the corresponding material should be recorded (e.g. starved for bottles, blocked for pallets, etc.)· Essentially only the machine state is recorded . This should also be visualised on the line monitor system, so the registration can be easily verified.
Expansions
11
I
Once the basis registration is implemented, the data acquisition and visualisation can be expanded, for several analysis and operation purposes: • failure reason for each machine failure • division between internal and external machine failures • partition of the state running in separate states for each speed (e.g. running at high speed, etc.) • measurement ofthe machine speeds, both the specified speed and the actual speed • counting the number of produced units for each machine • counting the number of produets on each buffer • counting the rejects, and recording the reasons for rejects • production planning and reality • etc. These expansions allow further analysis by detecting relations between quantities and also can help to achieve a better process contro\.
• A machine can be in only one state (see also chapter 4)
73
Recommendations Some recommendations In implementing a Line Monitor System (LMS) to perform efficiency analysis are: • construct a functional specification before implementing a LMS • create a stable technical environment • consider the organisational implementation • build the system step by step • try to make information technology decisions based on costlbenefit analysis • emphasise aspects like easy to use analysis tooIs, friendliness, intuitive graphical interface, and flexibility • combine automatic and manual data, especially record planned downtime, incidents and exceptions • implement the LMS before the packaging line is taken in use, so the process data is available in the line acceptance test • etc.
74
ApPENDIX
C: SIMULATION USING UNICORN
This appendix describes a simple simulation model for series models of packaging lines, that was developed by professor Roger Cooke of the Delft University of Technology. Only indicative conclusions may be drawn from this simulation model. First the software package Unicorn is described, then the mathematical model is formulated . Finally an example is given of an application of the simulation model on packaging line 2.
C.I
Unicorn
Unicorn· is computer program for perforrning uncertainty analysis on moderately sized problems [6]. The program is mainly designed to facilitate experimentation with small to medium sized problems so as to gain insight into the probabilistic behaviour of real mathematical modeis.
C2
Mathematica) model
A packaging line is modelled as a continuous production line with buffers, constant production rates, discrete time and stochastic availability. The model is explained below with six machines and five buffers:
Figure 25: Representation of a six-machine packaging fine Let Vj be the production rate of machine i, i=I , ... ,6; i.e. Vj units can be processed in one time step. Now bj is the actual amount in buffer i, i=I , ...,5 at time 0; the dependence on 0 will be suppressed in the notation. And kj is the maximal amount in buffer i. At the first time step, bj=O. For every time: 0 :s; b j :s; kj, i= 1, .. ,5 The time 0 is chosen such that the maximal amount moved in one time step, Vj, i=I, .. .,6; is at most one half of the buffer si ze kj, j= 1, ... ,5. A variabie Xj is introduced as a state indicator for machine i, such that at each time step: I if machine i is available j
x = { 0 if machine i is not available
i= I, .. .,6
At the first time step we assume every machine is working. Further, we introduce for each time step the throughput for machine j : thj = number of units moved from j-l to j
• © SSOR TU Delft
75
We use the notation PREV(z) to indicate the value ofz in the previous time step, where z may be any ofthe above variables.
Mass balance equations The mass balance equations may then be written as: LlOUT = min{v6*X6, PREV(b s)} b s = min{ks, PREV(bs) - LlOUT + min{vs*xs, PREV(b 4)} } b4 =
min{~,
PREV(b 4) - ths + min{v4*X4, PREV(b 3)}
}
The throughput quantities can be expressed as: ths
=
t~ =
bs - (PREV(b s) - ó.OUT) b4 - (PREV(b 4)
-
ths)
It will be observed that bi can be computed on the basis of Xi, bi+ 1, . values of the buffers.
.,
bs and the previous
Availability We assume that the up- and down-events for machine i can be modelled as independent failure and repair distributions. We use a discrete version of the exponential distribution, so that events which happen during a time step are modelled as if they occurred at the end of the time step. Thus, if machine i is down at the beginning of the previous time step, the probability of it being up at the beginning of the cunent time step is: l-el'i, where ~i is the repair rate for machine i. If machine i is up at the beginning of the previous time step, the probability of it being up at the beginning of the cunent time step is: e"Ài, where Ài is the failure rate for machine i. The time step must be chosen such that the probability of a failure-and-repair in one time step in negligible. Let Ui be uniformly distributed on [0,1]; then setting: I ifPREV(xJ = 1 and UI :s; e",ll Xi == 1 ifPREV(xJ = 1 and U j :s; 1- e -jli { o otherwise we have that Xi has the required distribution; the periods in which Xi= 1 contiguously approximately followan exponential distribution with 'failure rate' Ài, and the periods when Xi=O contiguously approximately followan exponential distribution with 'repair rate' ~i· .
• In the implementation the Uj are chosen as independent, but there is no mathematical necessity for this.
76
The availability of Xi is the probability that Xi= 1. In general this is a function of time and depends on the initial state of Xi when time begins. However, for large time values the initial state is ' forgotten' and the ' equilibrium availability' of Xi is found by setting P(Xi= 1)=P(PREV(Xi)= 1) in:
P(Xi= 1)=P(Xi= llPREV(Xi)= 1))P(PREV(Xi)= 1)+ P(Xi= IIPREV(Xi)=O) )P(PREV(Xi)=O) The re sult" is:
Output variables The following variables are evaluated at each time step: TIME is the cumulative e\apsed time up to the time step ,10UT is the increment in output for that time step OUT is the cumulative output up to that time step RATE is OUT/TIME What the model does not describe The model does not describe variations in production rate within each time step. Nor does it model the processing time for each machine. The pasteuriser for example requires about 45min to process the bottles. Once the pasteuriser is full, of course, bottles enter and leave at the same rate and the processing time is effectively zero. However, following each product change and buffer drainage, 45 min win be consumed in simply filling the pasteuriser. The model can accommodate dependencies between machine unavailabilities, One might anticipate that unavailabilities of adjacent machines would be negatively correlated, since machines will not fail while they are starved or blocked due to the unavailability of a neighbour. Further one would expect such negative dependence to be strongest immediately following a buffer evacuation and to decrease in strength as buffer contents increase. The model, however cannot handle temporal behaviour of correlation, it can only replicate average correlation over time. Further, the model assumes that for each machine the failure and rep air processes are independent and exponential. This assumption could be relaxed. Zero- and lnfinite-buffer limits The performance of the line can be theoretically bounded by the zero-buffer and the infinite-buffer limits. With zero buffers, the line behaves as a series system: the failure of one machine brings the entire line down, and the availability of the line is the product of the individual availabilities. This assumes that the machines can fail independently; in particular it assumes that one machine can fail while another is down. The rate of the line when all machines are up is the rate of the slowest machine . • The commonly used fommla 1l;!(lli+Ài) is approximated for !li~O.l and À i~O . 1
77
With infinite buffers in equilibrium, the effectively slowest machine will never be starved or blocked. Machines upstream and downstream trom this machine (we assume that there is a unique effectively slowest machine) produce at an average rate equa! to that of the slowest effective rate. They will be starved and blocked trom time to time. So, the throughput of the slowest machine is independent of failures of other machines. With infinite buffers, as the line approaches equilibrium, the production rate approaches the slowest effective rate. When the line is first started with empty buffers, it behaves somewhat like a series system. As soon as one machine is down, the entire line goes down and there is no output. If all machines are up the production rate is equa! to the lowest production rate. However, the availability ofthe system is the product ofthe availabilities ofthe individua! machines. If these availabilities were at equilibrium, then the expected output per time step is the zero buffer limit. On the other hand, the machines are assumed to start in the up state, whereas the zero buffer limit assumes the initia! state has been 'forgotten'. As a general rule, if the buffers are large enough to make the line behave like the infinite buffer line at equilibrium, then we could improve the machine with the slowest effective rate by increasing its speed, increasing its MTBF, or decreasing its MTTR, and these improvements translate directly to the line. However, improvements beyond the next slowest effective rate would not pay off in higher production. This general rule does not hold if the line does not reach equilibrium, or if the equilibrium is not the infinite buffer equilibrium.
C.3
Example
The simulation model can be used to determine the maximum productivity of a series packaging line, like packaging line 2. This paragraph describes how this is done, however no rea! data are shown here. First the notion of maximum productivity must be defined. Next, the model parameters are listed, i.e. the line parameters that deterrnine the productivity. Then the parameter values must be estimated, and using these values the model can be validated. Next the zero- and infinite buffer limits for the productivity can be are calculated and the maximum productivity can be estimated with the simulation model. The influence of the values ofthe model parameters can be shown in so-called high-Iow diagrams. Maximum productivity As a measure for the productivity we use the line efficiency 7]Iine, i.e. the percentage ofthe actual output versus the possible output (see also chapter 3). We consider the line efficiency that is achieved during norma! production. So, changeovers, maintenance, start-up etc. are not considered. This line efficiency is the long term average line efficiency (or equilibrium efficiency), or equivalently the expected line efficiency during norma! production. The va!ue of this expected efficiency should be equal to the norm efficiency as specified in the production plan, because disturbances of this efficiency, because of changeover, maintenance, start-up etc., should be incorporated with norm times or lower norm efficiencies. During normal production the real efficiency varies around the expected efficiency.
78
Line parameters The expected line efficiency is a stochastic variabie, i.e. the value ofthis variabie cannot be predicted with certainty. The line efficiency is a function of the line parameters. We consider the packaging line to be a series system of machines and buffers as shown in figure 26. The line parameters are formed by the machine and buffer parameters.
Figuur 26: Series system of machines and buffers The following machines are considered: 1. Depalletiser, where starvation of the depalletiser is also taken into in the availability, i.e. input problems and failures ofthe defoil machine are incorporated 2. Rinser/Filler 3. Pasteuriser, we assume it is fuIl and thus functions just like the other machines 4. Labelling machine 5. Packing machine, where the packer and dosing machine are seen as one machine (because there is no buffer in between) en the starvation of the packer for boxes (i.e. problems ofthe cartons street) are taken into in the availability 6. Palletiser, where backup of the paIletiser is taken into in the availability, i.e. output problems and failures on the shrink-wrap installation are incorporated. The values of the line parameters determine the line efficiency. These values have been coIlected and/or estimated. Static data can be measured or retrieved from the line specification. Dynamic data should be collected in a representative sample.
Machine parameters The machine parameters we consider are: the machine capacity and the failure behaviour, expressed in MTTR and MTBF. The machine capacity is the maximum machine production rate. These can be shown in a V-graph (see 5.4). The exact failure behaviour of a machine cannot be determined, because the data is never 100% correct, and because the failure behaviour changes over time. With the available data an average failure behaviour can be estimated for the period specified. We use: total time internal failures Estimate for the MTTR of a machine: - - - - - - - - - number of internal failures total time - total time internal failures Estimate for the MTBF of a machine: - - - - - - - - - - - - nu mb er of internal failures Using the individual failures confidence intervals can be constructed in the normal way.
Buffer parameters We only consider the buffer capacity, i.e. no transport characteristics of the buffers are modelled . The buffer capacity is the maximum number of units in the buffer
79
Model validation The above model is validated by using the data of a number of shifts and compare for each shift the true output or efficiency with the output or efficiency that is predicted by the model. A given machine behaviour can lead to different results, i.e. there is a certain spread in the results. Therefore several runs should be made with the model, each with a different random seed. If the true output is in the range of generated outputs the model is good. The results for the model varied. In general the model predictions are reasonable for such a simple model. Some shifts are the predictions are good, and some shifts they are very bad (especially for shifts with many machine failures). Because ofthe limitations and assumptions ofthe model, the results should be interpreted carefully. Zero- and Infinite buffer limits For the expected line efficiency two limits can be determines, by considering two extreme cases: the line without buffers will give a lower limit, the line with infinite buffers wil! give an upper limit. On the line without buffers every machine failure stops the entire line. On the line with infinite buffers the machines function independently. In reality the situation ofthe line is somewhere between these two extremes. The limits are defined as follows . The lower limit is the product of the machine availabilities x the minimum of the machine capacities; the upper limit is the minimum of the effective rates (see 5.1). Simulation The simulation model described above is used to estimate the expected line efficiency (i.e. the long term rate). The simulations show that it takes some time to reach this expected line efficiency when the line is started with empty buffers. This is probably because the line with empty buffers resembles a line without buffers, and a line in equilibrium is more like a line with infinite buffers. Influence analysis To determine the influence ofthe line parameters on the expected line efficiency so-called high-Iow graphs are created using simulation. To construct such a graph the line parameters are varied one at a time, taking a high value and a low value. The difference between the expected efficiencies for the high and the low value show how much influence the line parameter has on the expected efficiency. An example is shown in figure 27. TJline
+10% +5%
expectation
-5% -10o/0L-__________________________________~ A
B
c
D
E
parameter
Figure 27: High-Iow diagramfor the fine efficiency, with 5 parameters
80
The following reports appeared in the WBBM Report Series: 1 W . Osman, A Design of an MSS for Integrated Program & Proj ect Management 2 J.J. de Jonge, Maintenance Management and Modelling 3 B. Meima, Expert Opinion anel Space Del)l·is 4 I":. Wouterse, Design of a Management ing System for Distributeel Proeluction Planning 5 P.J.M. Waasdolp, Forecas ting and Inventory Replenishment in a Distribution Chain 6 R.A.L. Slaats, PlanningsalgoritmE's voor l\:IRP 7 H.C . Vos, A Multi-Component Maintenance Model with Discounts 8 G. Dijkhuizen, Inventory Management with Integrated Regldar and Express Ordering 9 R . van Dorp, Dependence Moclelling for U nCE'rtainty Analysis 10 D. van Schooneveld, Fracta.l Coeling of Monchrome Digi tal Im ages 11 D. Roeleven, Moclelling the Probability of Accident for lnl and \Vaterway Transport 12 W. van der Sluis, The Coorclin a.tion of Production and Di st.ribution in a Decent ra.li zed Distribution Chain: A Cont ract ll a l App roach 13 A.G. Chessa, Object-basecl Modelling of Hydrocarbon Reservoi rs
14 M. Kwak , Planning and Replenishm ent for a Seasonal Oemand Pattern 15 P. van Kampen, Maintenan ce Management of Multi-Component Obj ects 16 C. de Blois, Dynamic Pollu tant Transpo rt Modeling for Poli cy Evaill at ion in the Rhine Basin
17 G. van Acken, Hoe goed is een kl ant? 18 J.B. Molenkamp , Matching of assets an d liabilities for pension fund s 19 A.J. Bomans , Validation of a Model for Optimising Decisions on Maintenance 20 M.A. Odijk, Performance Evaluation of Railway Junction Track Layout Designs
21 S.M. Geervliet, Modellering van de Faalkans van Ondergrondse Transportleidingen 22 R.R. Witberg, A Ne ural Network Solution to Wireline- log Recognition Applications 23 H. de Blank , Beslissingsondersteunend Systeem voor het Persproces van Mengvoeders
24 M.C. Rozema, RailEase, Ondersteuning bij het Specificeren van Railinfrastructuur in Knooppunten 25 J. Dorrepaal, Analysis Tools for Reliability Databases
26 G.M. te Brake, Automated Detection of Stellate Lesions and Architectural Distortions in Digital Mammograms 27 S.T. van Houwelingen, Petrophysical Conductivity Modelling - Determination of Effective Conductivity and Electro-Type TooI Response Modelling 28 R.P.M . Goverde, Civil Aircraft Autopilot Design Using Robust Control 29 W. W.J. Götz, Infiuence Diagrams and Decision Trees in Severe Accident Management
30 J.P.A . van der Vliet, Assets Liability Matching for Life Insurers
31 M.P.C. Alders , Spatio-spectral Analysis of Wireline Logs 32 J .W.P. Karelse, Risicomanagement bij een Woningcorporatie met Monte Carlo Simu-
laties
The Department pfMathematics and Computer Science at De1ft UniveFsity of TechnolQgy offers a selecte4f gJ"ou,p' of peopte a two-year post-Master's program featu.ring speciali~ed instruction in practical mathematical modeling and consultancy skills (in Duteh: Wiskundige Beheers-en Beleidsmodellen). Participants follow courses in the first year of tl1e programand apply their skills in a project in the second year. Projects-are carried out under contract with a company or independent r~sear€h institute. The WBBM Report Seriescontains the .Linal report'5 of these pr'Ojects.
ISBN '10
Delft University of Technology Wiskundige Beheers- en Beleidsmodellen
:IJ
9 . 89fl I
I.
Related Documents 3m3m1z

V-graph Packaging Heineken 563n1q
November 2021 0
Heineken 1y4n3y
April 2021 0
Heineken 1y4n3y
July 2021 0
Foda Heineken 2r463j
October 2019 86
Heineken Zero 44375r
July 2022 0
Cerveza Heineken 5b3x2g
July 2022 0More Documents from "Anderson Gomes" 245x71

6l6m1j
November 2019 18
Pozzoli-partes-3-e-4-completo-pt-br.pdf d206h
December 2021 0
V-graph Packaging Heineken 563n1q
November 2021 0
Elementary-snare-drum-studies-mitchell-peters-pdf-pdf.pdf 2q603n
October 2019 1,101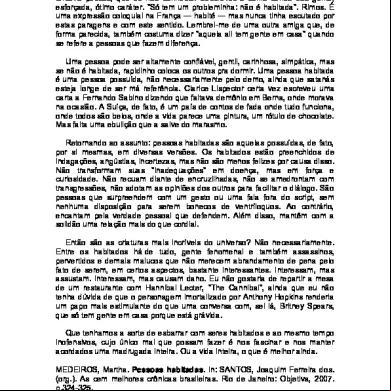
Pessoas Habitadas - Martha Medeiros 2e2u
March 2021 0