Wireshark Tutorial 1 231u31
This document was ed by and they confirmed that they have the permission to share it. If you are author or own the copyright of this book, please report to us by using this report form. Report 3b7i
Overview 3e4r5l
& View Wireshark Tutorial 1 as PDF for free.
More details w3441
- Words: 860
- Pages: 10
Wireshark Tutorial: Tracing HTTP with Wireshark 1. Preparing the Browser Most web browsers are configured to display a home page when the browser is first started. This home page will have an undesirable effect when attempting to analyze packets sent by the web browser. The homepage will cause a flurry of network packets to be sent when the web browser is first opened. This amounts to extra data being captured that has nothing to do with the web site being analyzed. To avoid this, set the web browser’s home page to “blank”. This can easily be done using the browser preferences menu in Firefox, which is shown in Figure 1
Figure 1: Internet Explorer Preferences As seen in Figure 1, Internet Explorer can be configured to use a blank homepage by clicking the “Use Blank Page” button.
To set the home page to blank in Internet Explorer use the “Internet Options” menu. This option is located under the tools menu. Now that the browser is set up, WireShark can be started. When WireShark is started, it will appear similar to Figure 2
Figure 2: WireShark
Now that WireShark has been started, it is time to use it to monitor HTTP traffic. This will be covered in the next sections. 2. Select an Interface Before packets can be captured with WireShark, WireShark must be told what interface the packets should be captured from. This will most likely be the Ethernet card. However, if a dial-up modem connection is being used, then it should be specified that as the interface. Select the “Interfaces...” option of the “Capture” menu. WireShark will now appear as the image in Figure 3.
Figure 3: Select an Interface
Once the correct interface is found, notice its “Capture” button next to the interface. As mentioned previously, the browser’s home page should be set to blank and the browser’s cache cleared. Once these steps have been preformed the “Capture” button can be pressed. This will begin the process of capturing packets. 3. Capturing Packets Once the “Capture” button has been pressed, packet capture will begin. Capturing packets is the main task usually performed by a network analyzer. The term “capture” may be a bit misleading. The packets are left “as is” and are not taken out of the network stream. Rather the packets are “spied” upon. These packets will contain the HTTP requests and responses being transferred between the web browser and the desired web server. While capturing packets, WireShark will appear as the image in Figure 4.
Figure 4: Capturing Packets
Now that packets are being captured the browser should be started. Proceed to the following URL: http://www.ietf.org Once the web page has completely displayed, close the web browser. Now select WireShark. WireShark will now appear as the image in Figure 5.
Figure 5: Captured Packets
As can be seen from Figure 5, there are quite a few packets! a filter. 4. Filtering Packets Look at Figure 5. Notice the “Protocol” column. This column contains a few packets of the type HTTP. These are the packets that are of interest. We will filter out all other packets. To create a filter, click on the “Expression?” button. This will display the image in Figure 6.
Figure 6: Filter Options
From this window choose HTTP (highlight it) from the “Field Name” list, and “is present” from the “Relation” list. Once these two are chosen, click “OK”. This will return you to the packet list screen, seen in Figure 5. At this point all of the packets are still visible. This is because no filtering has yet taken place. To use the filter, click the “Apply” button near the “Expression” button that was clicked to create the filter. Once the filter is applied, there will be considerably fewer packets. Figure 7 shows the filtered packet list. Only HTTP packets will be left. You can also filter by typing HTTP in the Filter field and clicking the “Apply” button.
Figure 7: Filtered to Only HTTP Packets
5. Examining a HTTP Request We will now examine an HTTP request in greater detail. Click on the first row, as seen in Figure 7. The middle pane should be resized to be larger so that the HTTP headers can be seen. This will result in Figure 8 appearing.
Figure 8: The Parts of an HTTP Request Packet
As can seen in Figure 8 the packet is broken into the following sections: •
Frame 433
•
Ethernet II
•
Internet Protocol (IP)
•
Transmission Control Protocol (T)
•
Hypertext Transfer Protocol (HTTP)
Of these, the only one that is important is the HTTP part of the packet. Clicking the plus (+) next to this section will expand it. After expanding, the HTTP part of the packet is seen as in Figure 9.
Figure 9: An HTTP Request
The HTTP headers for this GET request can be seen in Figure 9.
6. Examining an HTTP Response. HTTP responses can also be examined using WireShark. Figure 10 shows one of the response packets from above.
Figure 10: An HTTP Response
As seen in Figure 10 there are a different set of headers that come back from the server.
Related Documents 3m3m1z

Wireshark Tutorial 1 231u31
June 2022 0
Ethereal Wireshark Tutorial 13391n
November 2019 53
Laboratorio 1 - Wireshark 2m6y3q
December 2020 0
Wireshark Lab#1 802.11 4l5e1e
December 2019 108
8. Wireshark (1) fn2s
December 2019 31
1.laboratorio Introduccion Wireshark 6h6v5y
January 2023 0More Documents from "Tyson Loveless" 3p6v4j
Wireshark Tutorial 1 231u31
June 2022 0
Festo Didactic Hidraulica Pdf 5t4e3h
June 2022 0
Honda Goldwing 1800 Service Manual 4z5v6p
April 2020 31
Proyecto Enjuague Bucal..docx f3b5a
December 2019 27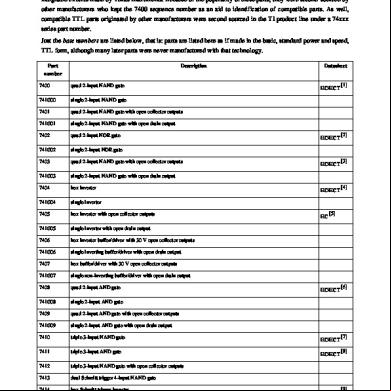
List Of 7400 Series Integrated Circuits 5m6f5g
December 2019 80