Key Financial Ratios Of Icici Bank l2f71
This document was ed by and they confirmed that they have the permission to share it. If you are author or own the copyright of this book, please report to us by using this report form. Report 3b7i
Overview 3e4r5l
& View Key Financial Ratios Of Icici Bank as PDF for free.
More details w3441
- Words: 3,081
- Pages: 13
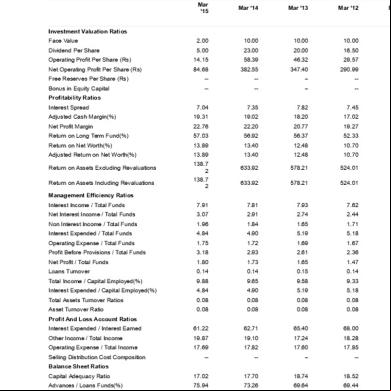
Key Financial Ratios of ICICI Bank
Mar '15
Mar '14
Mar '13
Mar '12
Face Value
2.00
10.00
10.00
10.00
Dividend Per Share
5.00
23.00
20.00
16.50
Investment Valuation Ratios
Operating Profit Per Share (Rs)
14.15
58.39
46.32
29.57
Net Operating Profit Per Share (Rs)
84.68
382.55
347.40
290.99
Free Reserves Per Share (Rs)
--
--
--
--
Bonus in Equity Capital
--
--
--
--
7.04
7.35
7.82
7.45
Adjusted Cash Margin(%)
19.31
19.02
18.20
17.02
Net Profit Margin
22.76
22.20
20.77
19.27
Return on Long Term Fund(%)
57.03
56.92
56.37
52.33
Return on Net Worth(%)
13.89
13.40
12.48
10.70
Adjusted Return on Net Worth(%)
13.89
13.40
12.48
10.70
633.92
578.21
524.01
633.92
578.21
524.01
Profitability Ratios Interest Spread
Return on Assets Excluding Revaluations Return on Assets Including Revaluations
138.7 2 138.7 2
Management Efficiency Ratios Interest Income / Total Funds
7.91
7.81
7.93
7.62
Net Interest Income / Total Funds
3.07
2.91
2.74
2.44
Non Interest Income / Total Funds
1.96
1.84
1.65
1.71
Interest Expended / Total Funds
4.84
4.90
5.19
5.18
Operating Expense / Total Funds
1.75
1.72
1.69
1.67
Profit Before Provisions / Total Funds
3.18
2.93
2.61
2.36
Net Profit / Total Funds
1.80
1.73
1.65
1.47
Loans Turnover
0.14
0.14
0.15
0.14
Total Income / Capital Employed(%)
9.88
9.65
9.58
9.33
Interest Expended / Capital Employed(%)
4.84
4.90
5.19
5.18
Total Assets Turnover Ratios
0.08
0.08
0.08
0.08
Asset Turnover Ratio
0.08
0.08
0.08
0.08
Interest Expended / Interest Earned
61.22
62.71
65.40
68.00
Other Income / Total Income
19.87
19.10
17.24
18.28
Operating Expense / Total Income
17.69
17.82
17.60
17.85
--
--
--
--
Capital Adequacy Ratio
17.02
17.70
18.74
18.52
Advances / Loans Funds(%)
75.94
73.26
69.64
69.44
104.7 2
100.71
99.25
97.71
Profit And Loss Ratios
Selling Distribution Cost Composition Balance Sheet Ratios
Debt Coverage Ratios Credit Deposit Ratio
M
Investment Deposit Ratio
52.43
55.79
60.38
61.16
Cash Deposit Ratio
6.85
6.54
7.21
8.60
Total Debt to Owners Fund
4.50
4.53
4.39
4.23
Financial Charges Coverage Ratio
0.68
0.62
0.52
0.48
Financial Charges Coverage Ratio Post Tax
1.39
1.37
1.34
1.31
0.06
0.09
0.09
0.07
13.81
11.31
10.53
16.71
Dividend Payout Ratio Net Profit
25.93
27.07
27.71
29.41
Dividend Payout Ratio Cash Profit
24.49
25.57
26.17
27.21
Earning Retention Ratio
74.07
72.93
72.29
70.59
Cash Earning Retention Ratio
75.51
74.43
73.83
72.79
AdjustedCash Flow Times
30.55
31.96
33.19
36.55
Mar '15
Mar '14
Mar '13
Mar '12
Earnings Per Share
19.28
84.95
72.17
56.09
Book Value
138.7 2
633.92
578.21
524.01
Mar '15
Mar '14
Mar '13
Mar '12
1.00
10.00
10.00
10.00
Leverage Ratios Current Ratio Quick Ratio Cash Flow Indicator Ratios
M
Source : Dion Global Solutions Limited
Key Financial Ratios of State Bank of India
M
Investment Valuation Ratios Face Value Dividend Per Share
3.50
30.00
41.50
35.00
23.38
199.45
236.63
271.65
204.13
1,826.36
1,749.29
1,587.40
Free Reserves Per Share (Rs)
--
--
--
--
Bonus in Equity Capital
--
--
--
--
Interest Spread
6.26
5.76
5.95
6.87
Adjusted Cash Margin(%)
8.12
7.89
11.23
10.51
Operating Profit Per Share (Rs) Net Operating Profit Per Share (Rs)
Profitability Ratios
Net Profit Margin
8.59
7.98
11.78
10.99
Return on Long Term Fund(%)
90.85
87.28
96.35
97.36
Return on Net Worth(%)
10.20
9.20
14.26
13.94
1,
Adjusted Return on Net Worth(%)
10.20
9.20
14.26
13.94
Return on Assets Excluding Revaluations
172.04
1,584.34
1,445.60
1,251.05
1,
Return on Assets Including Revaluations
172.04
1,584.34
1,445.60
1,251.05
1,
Interest Income / Total Funds
7.94
8.12
8.25
8.32
Net Interest Income / Total Funds
2.87
2.93
3.06
3.38
Non Interest Income / Total Funds
1.18
1.10
1.11
1.12
Interest Expended / Total Funds
5.07
5.19
5.19
4.94
Operating Expense / Total Funds
1.96
2.05
1.94
1.96
Profit Before Provisions / Total Funds
2.03
1.91
2.14
2.47
Net Profit / Total Funds
0.68
0.65
0.97
0.91
Loans Turnover
0.12
0.12
0.13
0.13
Total Income / Capital Employed(%)
9.11
9.22
9.35
9.45
Interest Expended / Capital Employed(%)
5.07
5.19
5.19
4.94
Total Assets Turnover Ratios
0.08
0.08
0.08
0.08
Asset Turnover Ratio
0.08
0.09
0.09
0.09
Interest Expended / Interest Earned
63.90
63.86
62.95
59.36
Other Income / Total Income
12.90
11.98
11.82
11.87
Operating Expense / Total Income
21.47
22.20
20.74
20.73
--
--
--
--
Capital Adequacy Ratio
12.00
12.96
12.92
13.86
Advances / Loans Funds(%)
77.39
82.04
82.25
78.01
Credit Deposit Ratio
84.47
86.84
85.17
82.14
Investment Deposit Ratio
30.07
28.85
29.52
30.73
6.76
5.81
5.34
7.51
Management Efficiency Ratios
Profit And Loss Ratios
Selling Distribution Cost Composition Balance Sheet Ratios
Debt Coverage Ratios
Cash Deposit Ratio Total Debt to Owners Fund
12.28
11.79
12.16
12.43
Financial Charges Coverage Ratio
0.41
0.38
0.43
0.52
Financial Charges Coverage Ratio Post Tax
1.15
1.14
1.20
1.20
0.04
0.03
0.04
0.05
10.78
13.88
12.15
12.05
Dividend Payout Ratio Net Profit
19.51
20.56
20.12
20.06
Dividend Payout Ratio Cash Profit
17.98
18.32
18.62
18.47
Earning Retention Ratio
80.49
79.44
79.88
79.94
Cash Earning Retention Ratio
82.02
81.68
81.38
81.53
110.90
114.06
78.90
82.08
Mar '15
Mar '14
Mar '13
Mar '12
17.55
145.88
206.20
174.46
172.04
1,584.34
1,445.60
1,251.05
Leverage Ratios Current Ratio Quick Ratio Cash Flow Indicator Ratios
AdjustedCash Flow Times
Earnings Per Share Book Value
M
1,
Source : Dion Global Solutions Limited
Balance Sheet of State Bank of India
------------------- in Rs. Cr. ------------------Mar '15
Mar '14
Mar '13
Mar '12
M
12 mths
12 mths
12 mths
12 mths
Total Share Capital
746.57
746.57
684.03
671.04
Equity Share Capital
746.57
746.57
684.03
671.04
Share Application Money
0.00
0.00
0.00
0.00
Preference Share Capital
0.00
0.00
0.00
0.00
127,691.65
117,535.68
98,199.65
83,280.16
64,
Net Worth
128,438.22
118,282.25
98,883.68
83,951.20
64,
Deposits
1,576,793.2 4
1,394,408.51
1,202,739.57
1,043,647.36
933,
Borrowings
205,150.29
183,130.88
169,182.71
127,005.57
119,
Total Debt
1,781,943.5 3
1,577,539.39
1,371,922.28
1,170,652.93
1,053,
Other Liabilities & Provisions
137,698.05
96,412.96
95,455.07
80,915.09
105,
Total Liabilities
2,048,079.8 0
1,792,234.60
1,566,261.03
1,335,519.22
1,223,
Mar '15
Mar '14
Mar '13
Mar '12
M
12 mths
12 mths
12 mths
12 mths
1
115,883.84
84,955.66
65,830.41
54,075.94
94,
1
Capital and Liabilities:
Reserves
Assets Cash & Balances with RBI Balance with Banks, Money at Call
58,977.46
47,593.97
48,989.75
43,087.23
28,
Advances
1,300,026.3 9
1,209,828.72
1,045,616.55
867,578.89
756,
Investments
495,027.40
398,308.19
350,927.27
312,197.61
295,
9,329.16
8,002.16
6,595.71
5,133.87
4,
Revaluation Reserves
0.00
0.00
0.00
0.00
Accumulated Depreciation
0.00
0.00
0.00
0.00
9,329.16
8,002.16
6,595.71
5,133.87
0.00
0.00
409.31
332.68
Other Assets
68,835.55
43,545.90
47,892.03
53,113.02
43,
Total Assets
2,048,079.8 0
1,792,234.60
1,566,261.03
1,335,519.24
1,223,
Contingent Liabilities
1,093,422.5 1
1,091,358.37
993,018.45
899,565.18
790,
Gross Block
Net Block Capital Work In Progress
Bills for collection Book Value (Rs)
0.00
0.00
0.00
0.00
172.04
1,584.34
1,445.60
1,251.05
4,
1,
Profit & Loss of State Bank of India
------------------- in Rs. Cr. ------------------Mar '15
Mar '14
Mar '13
Mar '12
M
12 mths
12 mths
12 mths
12 mths
Interest Earned
152,397.0 7
136,350.80
119,657.10
106,521.45
81,3
Other Income
22,575.89
18,552.92
16,034.84
14,351.45
14,9
Total Income
174,972.9 6
154,903.72
135,691.94
120,872.90
96,3
Interest expended
97,381.82
87,068.63
75,325.80
63,230.37
48,8
Employee Cost
23,537.07
22,504.28
18,380.90
16,974.04
15,
Selling, & Misc Expenses
39,836.01
33,105.70
26,740.65
27,954.03
23,8
1,116.49
1,333.94
1,139.61
1,007.17
9
0.00
0.00
0.00
0.00
Operating Expenses
38,677.64
35,725.85
29,284.42
26,068.99
23,0
Provisions & Contingencies
25,811.93
21,218.07
16,976.74
19,866.25
17,0
Total Expenses
161,871.3 9
144,012.55
121,586.96
109,165.61
88,9
Mar '15
Mar '14
Mar '13
Mar '12
M
12 mths
12 mths
12 mths
12 mths
1
13,101.57
10,891.17
14,104.98
11,707.29
Extraordinary Items
0.00
0.00
0.00
0.00
Profit brought forward
0.32
0.34
0.34
6.05
13,101.89
10,891.51
14,105.32
11,713.34
1
Income
Expenditure
Depreciation Preoperative Exp Capitalised
Net Profit for the Year
Total
7,3
7,3
Preference Dividend Equity Dividend Corporate Dividend Tax
0.00
0.00
0.00
0.00
2,557.28
2,239.71
2,838.74
2,348.66
1,9
520.65
298.45
375.95
296.49
2
Per share data (annualised) Earning Per Share (Rs)
17.55
145.88
206.20
174.46
Equity Dividend (%)
350.00
300.00
415.00
350.00
3
Book Value (Rs)
172.04
1,584.34
1,445.60
1,251.05
1,0
10,023.64
8,353.03
10,890.29
9,067.85
5,2
Appropriations Transfer to Statutory Reserves Transfer to Other Reserves Proposed Dividend/Transfer to Govt Balance c/f to Balance Sheet Total
0.00
0.00
0.00
0.00
3,077.93
2,538.16
3,214.69
2,645.15
0.32
0.32
0.34
0.34
13,101.89
10,891.51
14,105.32
11,713.34
2,1
7,3
Source : Dion Global Solutions Limited
Balance Sheet of Axis Bank
------------------- in Rs. Cr. ------------------Mar '15
Mar '14
Mar '13
Mar '12
12 mths
12 mths
12 mths
12 mths
Total Share Capital
474.10
469.84
467.95
413.20
Equity Share Capital
M
1
Capital and Liabilities: 474.10
469.84
467.95
413.20
Share Application Money
0.00
0.00
0.00
0.00
Preference Share Capital
0.00
0.00
0.00
0.00
Reserves
44,202.41
37,750.64
32,639.91
22,395.34
18,
Net Worth
44,676.51
38,220.48
33,107.86
22,808.54
18,
Deposits
322,441.9 4
280,944.56
252,613.59
220,104.30
189,
Borrowings
79,758.27
50,290.94
43,951.10
34,071.67
26,
Total Debt
402,200.2 1
331,235.50
296,564.69
254,175.97
215,
Other Liabilities & Provisions
15,055.67
13,788.89
10,888.11
8,643.28
8,
Total Liabilities
461,932.3 9
383,244.87
340,560.66
285,627.79
242,
Mar '15
Mar '14
Mar '13
Mar '12
M
12 mths
12 mths
12 mths
12 mths
1
Cash & Balances with RBI
19,818.84
17,041.32
14,792.09
10,702.92
13,
Balance with Banks, Money at Call
16,280.19
11,197.38
5,642.87
3,230.99
7,
230,066.76
196,965.96
169,759.54
142,
113,548.43
113,737.54
93,192.09
71,
Assets
Advances Investments
281,083.0 3 132,342.8
3 Gross Block Revaluation Reserves Accumulated Depreciation
2,413.05
2,310.54
2,230.54
2,188.56
0.00
0.00
0.00
0.00
2,
0.00
0.00
0.00
0.00
2,413.05
2,310.54
2,230.54
2,188.56
101.26
99.67
125.11
70.77
Other Assets
9,893.19
8,980.79
7,066.56
6,482.93
4,
Total Assets
461,932.3 9
383,244.89
340,560.67
285,627.80
242,
Contingent Liabilities
640,183.5 9
608,547.25
574,782.38
514,871.98
477,
0.00
0.00
0.00
0.00
188.47
813.47
707.50
551.99
Net Block Capital Work In Progress
Bills for collection Book Value (Rs)
Profit & Loss of Axis Bank
2,
------------------- in Rs. Cr. ------------------Mar '15
Mar '14
Mar '13
Mar '12
M
12 mths
12 mths
12 mths
12 mths
Interest Earned
35,478.6 0
30,641.16
27,182.57
21,994.65
15,1
Other Income
8,365.05
7,405.22
6,551.11
5,420.22
4,6
Total Income
43,843.6 5
38,046.38
33,733.68
27,414.87
19,7
Interest expended
21,254.4 6
18,689.52
17,516.31
13,976.90
8,5
Employee Cost
3,114.97
2,601.35
2,376.98
2,080.17
1,6
11,710.72
10,173.91
8,309.22
6,773.35
5,9
405.67
363.93
351.73
342.24
2
0.00
0.00
0.00
0.00
Operating Expenses
9,203.74
7,900.77
6,914.23
6,007.10
4,7
Provisions & Contingencies
6,027.62
5,238.42
4,123.70
3,188.66
3,0
Total Expenses
36,485.8 2
31,828.71
28,554.24
23,172.66
16,3
Mar '15
Mar '14
Mar '13
Mar '12
M
12 mths
12 mths
12 mths
12 mths
1
7,357.82
6,217.67
5,179.43
4,242.21
3,3
0.00
0.00
0.00
0.00
10,029.26
7,329.45
4,969.77
3,4
16,246.93
12,508.88
9,211.98
6,8
0.00
0.00
0.00
1
Income
Expenditure
Selling, & Misc Expenses Depreciation Preoperative Exp Capitalised
Net Profit for the Year Extraordinary Items Profit brought forward Total Preference Dividend
13,501.4 5 20,859.2 7 0.00
Equity Dividend
1,087.54
939.69
843.86
658.24
221.42
161.44
143.37
111.83
31.04
132.33
110.68
102.67
Equity Dividend (%)
230.00
200.00
180.00
160.00
1
Book Value (Rs)
188.47
813.47
707.50
551.99
4
1,926.82
1,644.36
1,492.38
1,112.46
8
0.00
-0.01
0.01
0.00
3
1,308.96
1,101.13
987.23
770.07
6
13,501.45
10,029.26
7,329.45
4,9
16,246.93
12,508.88
9,211.98
6,8
Corporate Dividend Tax
5
Per share data (annualised) Earning Per Share (Rs)
Appropriations Transfer to Statutory Reserves Transfer to Other Reserves Proposed Dividend/Transfer to Govt Balance c/f to Balance Sheet Total
17,623.4 9 20,859.2 7
Source : Dion G
Profit & Loss of Axis Bank
------------------- in Rs. Cr. ------------------Mar '15
Mar '14
Mar '13
Mar '12
M
12 mths
12 mths
12 mths
12 mths
1
Interest Earned
35,478.6 0
30,641.16
27,182.57
21,994.65
15,
Other Income
8,365.05
7,405.22
6,551.11
5,420.22
4,
Total Income
43,843.6 5
38,046.38
33,733.68
27,414.87
19,
21,254.4 6
18,689.52
17,516.31
13,976.90
8,
Income
Expenditure Interest expended Employee Cost
3,114.97
2,601.35
2,376.98
2,080.17
1,
11,710.72
10,173.91
8,309.22
6,773.35
5,
405.67
363.93
351.73
342.24
0.00
0.00
0.00
0.00
Operating Expenses
9,203.74
7,900.77
6,914.23
6,007.10
4,
Provisions & Contingencies
6,027.62
5,238.42
4,123.70
3,188.66
3,
Total Expenses
36,485.8 2
31,828.71
28,554.24
23,172.66
16,
Mar '15
Mar '14
Mar '13
Mar '12
Selling, & Misc Expenses Depreciation Preoperative Exp Capitalised
M
Net Profit for the Year Extraordinary Items Profit brought forward Total Preference Dividend
12 mths
12 mths
12 mths
12 mths
1
7,357.82
6,217.67
5,179.43
4,242.21
3,
0.00
0.00
0.00
0.00
10,029.26
7,329.45
4,969.77
3,
16,246.93
12,508.88
9,211.98
6,
13,501.4 5 20,859.2 7 0.00
0.00
0.00
0.00
1,087.54
939.69
843.86
658.24
221.42
161.44
143.37
111.83
31.04
132.33
110.68
102.67
Equity Dividend (%)
230.00
200.00
180.00
160.00
Book Value (Rs)
188.47
813.47
707.50
551.99
1,926.82
1,644.36
1,492.38
1,112.46
0.00
-0.01
0.01
0.00
1,308.96
1,101.13
987.23
770.07
13,501.45
10,029.26
7,329.45
4,
16,246.93
12,508.88
9,211.98
6,
Equity Dividend Corporate Dividend Tax Per share data (annualised) Earning Per Share (Rs)
Appropriations Transfer to Statutory Reserves Transfer to Other Reserves Proposed Dividend/Transfer to Govt Balance c/f to Balance Sheet Total
17,623.4 9 20,859.2 7
Source : Dion G
Balance Sheet of ICICI Bank
------------------- in Rs. Cr. ------------------Mar '15
Mar '14
Mar '13
Mar '12
M
12 mths
12 mths
12 mths
12 mths
1
Total Share Capital
1,159.66
1,155.04
1,153.64
1,152.77
1,
Equity Share Capital
1,
Capital and Liabilities: 1,159.66
1,155.04
1,153.64
1,152.77
Share Application Money
7.44
6.57
4.48
2.39
Preference Share Capital
0.00
0.00
0.00
0.00
Reserves
79,262.26
72,051.71
65,547.84
59,250.09
53,
Net Worth
80,429.36
73,213.32
66,705.96
60,405.25
55,
331,913.66
292,613.63
255,499.96
225,
154,759.05
145,341.49
140,164.91
109,
486,672.71
437,955.12
395,664.87
335,
Deposits Borrowings Total Debt
361,562.7 3 172,417.3 5 533,980.0 8
Other Liabilities & Provisions
31,719.86
34,755.55
32,133.60
17,576.98
15,
Total Liabilities
646,129.3 0
594,641.58
536,794.68
473,647.10
406,
Mar '15
Mar '14
Mar '13
Mar '12
M
12 mths
12 mths
12 mths
12 mths
1
Cash & Balances with RBI
25,652.91
21,821.83
19,052.73
20,461.29
20,
Balance with Banks, Money at Call
16,651.71
19,707.77
22,364.79
15,768.02
13,
338,702.65
290,249.44
253,727.66
216,
177,021.82
171,393.60
159,560.04
134,
4,725.52
4,678.14
4,647.06
4,614.69
4,
0.00
0.00
0.00
0.00
Assets
Advances Investments Gross Block Revaluation Reserves Accumulated Depreciation
387,522.0 7 186,580.0 3
0.00
0.00
0.00
0.00
4,725.52
4,678.14
4,647.06
4,614.69
0.00
0.00
0.00
0.00
Other Assets
24,997.05
32,709.39
29,087.07
19,515.39
16,
Total Assets
646,129.2 9
594,641.60
536,794.69
473,647.09
406,
Contingent Liabilities
868,190.5 8
794,965.35
802,383.84
923,037.16
931,
0.00
0.00
0.00
0.00
138.72
633.92
578.21
524.01
Net Block Capital Work In Progress
Bills for collection Book Value (Rs)
4,
Source : Dion Global Solutions Limited
Profit & Loss of ICICI Bank
------------------- in Rs. Cr. ------------------Mar '15
Mar '14
Mar '13
Mar '12
M
12 mths
12 mths
12 mths
12 mths
44,178.15
40,075.60
33,542.65
25,9
10,427.87
8,345.70
7,502.76
6,6
54,606.02
48,421.30
41,045.41
32,6
1
Income Interest Earned Other Income Total Income
49,091.1 4 12,176.1 3 61,267.2 7
Expenditure Interest expended
30,051.5 3
27,702.59
26,209.18
22,808.50
16,9
Employee Cost
4,749.88
4,220.11
3,893.29
3,515.28
2,8
Selling, & Misc Expenses
14,631.5 6
12,296.88
9,503.20
7,731.85
7,1
Depreciation Preoperative Exp Capitalised
658.95
575.97
490.16
524.53
5
0.00
0.00
0.00
0.00
11,495.83
10,308.86
9,012.89
7,850.44
6,6
Provisions & Contingencies
8,544.56
6,784.10
4,873.76
3,921.22
3,8
Total Expenses
50,091.9 2
44,795.55
40,095.83
34,580.16
27,4
Mar '15
Mar '14
Mar '13
Mar '12
M
12 mths
12 mths
12 mths
12 mths
1
11,175.35
9,810.48
8,325.47
6,465.26
5,1
0.00
0.00
0.00
0.00
9,902.29
7,054.23
5,018.18
3,4
19,712.77
15,379.70
11,483.44
8,6
Operating Expenses
Net Profit for the Year Extraordinary Items Profit brought forward Total Preference Dividend
13,318.5 9 24,493.9 4 0.00
0.00
0.00
0.00
2,898.81
2,656.28
2,307.23
1,902.04
1,6
271.15
231.25
292.16
220.35
2
19.28
84.95
72.17
56.09
Equity Dividend (%)
250.00
230.00
200.00
165.00
1
Book Value (Rs)
138.72
633.92
578.21
524.01
4
4,062.57
3,506.65
2,878.03
2,306.49
1,7
0.00
0.00
0.00
0.33
3,169.96
2,887.53
2,599.39
2,122.39
1,8
13,318.59
9,902.29
7,054.23
5,0
19,712.77
15,379.71
11,483.44
8,6
Mar '15
Mar '14
Mar '13
Mar '12
M
Face Value
2.00
10.00
10.00
10.00
Dividend Per Share
4.60
20.00
18.00
16.00
Operating Profit Per Share (Rs)
22.89
93.96
66.33
56.94
Net Operating Profit Per Share (Rs)
149.6 7
652.16
580.88
532.30
--
--
--
--
Equity Dividend Corporate Dividend Tax Per share data (annualised) Earning Per Share (Rs)
Appropriations Transfer to Statutory Reserves Transfer to Other Reserves Proposed Dividend/Transfer to Govt Balance c/f to Balance Sheet Total
17,261.4 2 24,493.9 5
Source : Dion Global Solutions Limited
Key Financial Ratios of Axis Bank
Investment Valuation Ratios
Free Reserves Per Share (Rs)
Bonus in Equity Capital
--
--
--
--
7.34
7.67
7.90
7.46
Adjusted Cash Margin(%)
17.70
17.29
16.39
16.72
Net Profit Margin
20.73
20.29
19.05
19.28
Return on Long Term Fund(%)
72.32
73.36
75.72
88.84
Return on Net Worth(%)
16.46
16.26
15.64
18.59
Adjusted Return on Net Worth(%)
16.46
16.26
15.64
18.59
813.47
707.50
551.99
813.47
707.50
551.99
Profitability Ratios Interest Spread
Return on Assets Excluding Revaluations Return on Assets Including Revaluations
188.4 7 188.4 7
Management Efficiency Ratios Interest Income / Total Funds
8.40
8.47
8.68
8.33
Net Interest Income / Total Funds
3.37
3.30
3.09
3.04
Non Interest Income / Total Funds
1.98
2.05
2.09
2.05
Interest Expended / Total Funds
5.03
5.16
5.59
5.29
Operating Expense / Total Funds
2.08
2.08
2.10
2.14
Profit Before Provisions / Total Funds
3.17
3.17
2.97
2.81
Net Profit / Total Funds
1.74
1.72
1.65
1.61
Loans Turnover
0.14
0.14
0.15
0.14
Total Income / Capital Employed(%)
10.38
10.51
10.77
10.38
Interest Expended / Capital Employed(%)
5.03
5.16
5.59
5.29
Total Assets Turnover Ratios
0.08
0.08
0.09
0.08
Asset Turnover Ratio
0.09
0.09
0.09
0.09
Interest Expended / Interest Earned
59.91
60.99
64.44
63.55
Other Income / Total Income
19.08
19.46
19.42
19.77
Operating Expense / Total Income
20.07
19.81
19.45
20.66
--
--
--
--
Capital Adequacy Ratio
15.09
16.07
17.00
13.66
Advances / Loans Funds(%)
76.65
73.29
71.53
72.29
Credit Deposit Ratio
84.71
80.03
77.58
76.26
Investment Deposit Ratio
40.75
42.60
43.77
40.35
Cash Deposit Ratio
6.11
5.97
5.39
6.01
Total Debt to Owners Fund
7.22
7.35
7.63
9.65
Financial Charges Coverage Ratio
0.65
0.63
0.55
0.56
Financial Charges Coverage Ratio Post Tax
1.37
1.35
1.32
1.33
0.03
0.03
0.03
0.03
20.64
18.57
20.10
21.63
Dividend Payout Ratio Net Profit
14.78
15.11
16.29
15.51
Dividend Payout Ratio Cash Profit
14.00
14.27
15.25
14.35
Earning Retention Ratio
85.22
84.89
83.71
84.49
Cash Earning Retention Ratio
86.00
85.73
84.75
85.65
Profit And Loss Ratios
Selling Distribution Cost Composition Balance Sheet Ratios
Debt Coverage Ratios
Leverage Ratios Current Ratio Quick Ratio Cash Flow Indicator Ratios
AdjustedCash Flow Times
41.53
42.69
45.67
48.01
Mar '15
Mar '14
Mar '13
Mar '12
Earnings Per Share
31.04
132.33
110.68
102.67
Book Value
188.4 7
813.47
707.50
551.99
Source : Dion Global Solutions Limited
M
Mar '15
Mar '14
Mar '13
Mar '12
Face Value
2.00
10.00
10.00
10.00
Dividend Per Share
5.00
23.00
20.00
16.50
Investment Valuation Ratios
Operating Profit Per Share (Rs)
14.15
58.39
46.32
29.57
Net Operating Profit Per Share (Rs)
84.68
382.55
347.40
290.99
Free Reserves Per Share (Rs)
--
--
--
--
Bonus in Equity Capital
--
--
--
--
7.04
7.35
7.82
7.45
Adjusted Cash Margin(%)
19.31
19.02
18.20
17.02
Net Profit Margin
22.76
22.20
20.77
19.27
Return on Long Term Fund(%)
57.03
56.92
56.37
52.33
Return on Net Worth(%)
13.89
13.40
12.48
10.70
Adjusted Return on Net Worth(%)
13.89
13.40
12.48
10.70
633.92
578.21
524.01
633.92
578.21
524.01
Profitability Ratios Interest Spread
Return on Assets Excluding Revaluations Return on Assets Including Revaluations
138.7 2 138.7 2
Management Efficiency Ratios Interest Income / Total Funds
7.91
7.81
7.93
7.62
Net Interest Income / Total Funds
3.07
2.91
2.74
2.44
Non Interest Income / Total Funds
1.96
1.84
1.65
1.71
Interest Expended / Total Funds
4.84
4.90
5.19
5.18
Operating Expense / Total Funds
1.75
1.72
1.69
1.67
Profit Before Provisions / Total Funds
3.18
2.93
2.61
2.36
Net Profit / Total Funds
1.80
1.73
1.65
1.47
Loans Turnover
0.14
0.14
0.15
0.14
Total Income / Capital Employed(%)
9.88
9.65
9.58
9.33
Interest Expended / Capital Employed(%)
4.84
4.90
5.19
5.18
Total Assets Turnover Ratios
0.08
0.08
0.08
0.08
Asset Turnover Ratio
0.08
0.08
0.08
0.08
Interest Expended / Interest Earned
61.22
62.71
65.40
68.00
Other Income / Total Income
19.87
19.10
17.24
18.28
Operating Expense / Total Income
17.69
17.82
17.60
17.85
--
--
--
--
Capital Adequacy Ratio
17.02
17.70
18.74
18.52
Advances / Loans Funds(%)
75.94
73.26
69.64
69.44
104.7 2
100.71
99.25
97.71
Profit And Loss Ratios
Selling Distribution Cost Composition Balance Sheet Ratios
Debt Coverage Ratios Credit Deposit Ratio
M
Investment Deposit Ratio
52.43
55.79
60.38
61.16
Cash Deposit Ratio
6.85
6.54
7.21
8.60
Total Debt to Owners Fund
4.50
4.53
4.39
4.23
Financial Charges Coverage Ratio
0.68
0.62
0.52
0.48
Financial Charges Coverage Ratio Post Tax
1.39
1.37
1.34
1.31
0.06
0.09
0.09
0.07
13.81
11.31
10.53
16.71
Dividend Payout Ratio Net Profit
25.93
27.07
27.71
29.41
Dividend Payout Ratio Cash Profit
24.49
25.57
26.17
27.21
Earning Retention Ratio
74.07
72.93
72.29
70.59
Cash Earning Retention Ratio
75.51
74.43
73.83
72.79
AdjustedCash Flow Times
30.55
31.96
33.19
36.55
Mar '15
Mar '14
Mar '13
Mar '12
Earnings Per Share
19.28
84.95
72.17
56.09
Book Value
138.7 2
633.92
578.21
524.01
Mar '15
Mar '14
Mar '13
Mar '12
1.00
10.00
10.00
10.00
Leverage Ratios Current Ratio Quick Ratio Cash Flow Indicator Ratios
M
Source : Dion Global Solutions Limited
Key Financial Ratios of State Bank of India
M
Investment Valuation Ratios Face Value Dividend Per Share
3.50
30.00
41.50
35.00
23.38
199.45
236.63
271.65
204.13
1,826.36
1,749.29
1,587.40
Free Reserves Per Share (Rs)
--
--
--
--
Bonus in Equity Capital
--
--
--
--
Interest Spread
6.26
5.76
5.95
6.87
Adjusted Cash Margin(%)
8.12
7.89
11.23
10.51
Operating Profit Per Share (Rs) Net Operating Profit Per Share (Rs)
Profitability Ratios
Net Profit Margin
8.59
7.98
11.78
10.99
Return on Long Term Fund(%)
90.85
87.28
96.35
97.36
Return on Net Worth(%)
10.20
9.20
14.26
13.94
1,
Adjusted Return on Net Worth(%)
10.20
9.20
14.26
13.94
Return on Assets Excluding Revaluations
172.04
1,584.34
1,445.60
1,251.05
1,
Return on Assets Including Revaluations
172.04
1,584.34
1,445.60
1,251.05
1,
Interest Income / Total Funds
7.94
8.12
8.25
8.32
Net Interest Income / Total Funds
2.87
2.93
3.06
3.38
Non Interest Income / Total Funds
1.18
1.10
1.11
1.12
Interest Expended / Total Funds
5.07
5.19
5.19
4.94
Operating Expense / Total Funds
1.96
2.05
1.94
1.96
Profit Before Provisions / Total Funds
2.03
1.91
2.14
2.47
Net Profit / Total Funds
0.68
0.65
0.97
0.91
Loans Turnover
0.12
0.12
0.13
0.13
Total Income / Capital Employed(%)
9.11
9.22
9.35
9.45
Interest Expended / Capital Employed(%)
5.07
5.19
5.19
4.94
Total Assets Turnover Ratios
0.08
0.08
0.08
0.08
Asset Turnover Ratio
0.08
0.09
0.09
0.09
Interest Expended / Interest Earned
63.90
63.86
62.95
59.36
Other Income / Total Income
12.90
11.98
11.82
11.87
Operating Expense / Total Income
21.47
22.20
20.74
20.73
--
--
--
--
Capital Adequacy Ratio
12.00
12.96
12.92
13.86
Advances / Loans Funds(%)
77.39
82.04
82.25
78.01
Credit Deposit Ratio
84.47
86.84
85.17
82.14
Investment Deposit Ratio
30.07
28.85
29.52
30.73
6.76
5.81
5.34
7.51
Management Efficiency Ratios
Profit And Loss Ratios
Selling Distribution Cost Composition Balance Sheet Ratios
Debt Coverage Ratios
Cash Deposit Ratio Total Debt to Owners Fund
12.28
11.79
12.16
12.43
Financial Charges Coverage Ratio
0.41
0.38
0.43
0.52
Financial Charges Coverage Ratio Post Tax
1.15
1.14
1.20
1.20
0.04
0.03
0.04
0.05
10.78
13.88
12.15
12.05
Dividend Payout Ratio Net Profit
19.51
20.56
20.12
20.06
Dividend Payout Ratio Cash Profit
17.98
18.32
18.62
18.47
Earning Retention Ratio
80.49
79.44
79.88
79.94
Cash Earning Retention Ratio
82.02
81.68
81.38
81.53
110.90
114.06
78.90
82.08
Mar '15
Mar '14
Mar '13
Mar '12
17.55
145.88
206.20
174.46
172.04
1,584.34
1,445.60
1,251.05
Leverage Ratios Current Ratio Quick Ratio Cash Flow Indicator Ratios
AdjustedCash Flow Times
Earnings Per Share Book Value
M
1,
Source : Dion Global Solutions Limited
Balance Sheet of State Bank of India
------------------- in Rs. Cr. ------------------Mar '15
Mar '14
Mar '13
Mar '12
M
12 mths
12 mths
12 mths
12 mths
Total Share Capital
746.57
746.57
684.03
671.04
Equity Share Capital
746.57
746.57
684.03
671.04
Share Application Money
0.00
0.00
0.00
0.00
Preference Share Capital
0.00
0.00
0.00
0.00
127,691.65
117,535.68
98,199.65
83,280.16
64,
Net Worth
128,438.22
118,282.25
98,883.68
83,951.20
64,
Deposits
1,576,793.2 4
1,394,408.51
1,202,739.57
1,043,647.36
933,
Borrowings
205,150.29
183,130.88
169,182.71
127,005.57
119,
Total Debt
1,781,943.5 3
1,577,539.39
1,371,922.28
1,170,652.93
1,053,
Other Liabilities & Provisions
137,698.05
96,412.96
95,455.07
80,915.09
105,
Total Liabilities
2,048,079.8 0
1,792,234.60
1,566,261.03
1,335,519.22
1,223,
Mar '15
Mar '14
Mar '13
Mar '12
M
12 mths
12 mths
12 mths
12 mths
1
115,883.84
84,955.66
65,830.41
54,075.94
94,
1
Capital and Liabilities:
Reserves
Assets Cash & Balances with RBI Balance with Banks, Money at Call
58,977.46
47,593.97
48,989.75
43,087.23
28,
Advances
1,300,026.3 9
1,209,828.72
1,045,616.55
867,578.89
756,
Investments
495,027.40
398,308.19
350,927.27
312,197.61
295,
9,329.16
8,002.16
6,595.71
5,133.87
4,
Revaluation Reserves
0.00
0.00
0.00
0.00
Accumulated Depreciation
0.00
0.00
0.00
0.00
9,329.16
8,002.16
6,595.71
5,133.87
0.00
0.00
409.31
332.68
Other Assets
68,835.55
43,545.90
47,892.03
53,113.02
43,
Total Assets
2,048,079.8 0
1,792,234.60
1,566,261.03
1,335,519.24
1,223,
Contingent Liabilities
1,093,422.5 1
1,091,358.37
993,018.45
899,565.18
790,
Gross Block
Net Block Capital Work In Progress
Bills for collection Book Value (Rs)
0.00
0.00
0.00
0.00
172.04
1,584.34
1,445.60
1,251.05
4,
1,
Profit & Loss of State Bank of India
------------------- in Rs. Cr. ------------------Mar '15
Mar '14
Mar '13
Mar '12
M
12 mths
12 mths
12 mths
12 mths
Interest Earned
152,397.0 7
136,350.80
119,657.10
106,521.45
81,3
Other Income
22,575.89
18,552.92
16,034.84
14,351.45
14,9
Total Income
174,972.9 6
154,903.72
135,691.94
120,872.90
96,3
Interest expended
97,381.82
87,068.63
75,325.80
63,230.37
48,8
Employee Cost
23,537.07
22,504.28
18,380.90
16,974.04
15,
Selling, & Misc Expenses
39,836.01
33,105.70
26,740.65
27,954.03
23,8
1,116.49
1,333.94
1,139.61
1,007.17
9
0.00
0.00
0.00
0.00
Operating Expenses
38,677.64
35,725.85
29,284.42
26,068.99
23,0
Provisions & Contingencies
25,811.93
21,218.07
16,976.74
19,866.25
17,0
Total Expenses
161,871.3 9
144,012.55
121,586.96
109,165.61
88,9
Mar '15
Mar '14
Mar '13
Mar '12
M
12 mths
12 mths
12 mths
12 mths
1
13,101.57
10,891.17
14,104.98
11,707.29
Extraordinary Items
0.00
0.00
0.00
0.00
Profit brought forward
0.32
0.34
0.34
6.05
13,101.89
10,891.51
14,105.32
11,713.34
1
Income
Expenditure
Depreciation Preoperative Exp Capitalised
Net Profit for the Year
Total
7,3
7,3
Preference Dividend Equity Dividend Corporate Dividend Tax
0.00
0.00
0.00
0.00
2,557.28
2,239.71
2,838.74
2,348.66
1,9
520.65
298.45
375.95
296.49
2
Per share data (annualised) Earning Per Share (Rs)
17.55
145.88
206.20
174.46
Equity Dividend (%)
350.00
300.00
415.00
350.00
3
Book Value (Rs)
172.04
1,584.34
1,445.60
1,251.05
1,0
10,023.64
8,353.03
10,890.29
9,067.85
5,2
Appropriations Transfer to Statutory Reserves Transfer to Other Reserves Proposed Dividend/Transfer to Govt Balance c/f to Balance Sheet Total
0.00
0.00
0.00
0.00
3,077.93
2,538.16
3,214.69
2,645.15
0.32
0.32
0.34
0.34
13,101.89
10,891.51
14,105.32
11,713.34
2,1
7,3
Source : Dion Global Solutions Limited
Balance Sheet of Axis Bank
------------------- in Rs. Cr. ------------------Mar '15
Mar '14
Mar '13
Mar '12
12 mths
12 mths
12 mths
12 mths
Total Share Capital
474.10
469.84
467.95
413.20
Equity Share Capital
M
1
Capital and Liabilities: 474.10
469.84
467.95
413.20
Share Application Money
0.00
0.00
0.00
0.00
Preference Share Capital
0.00
0.00
0.00
0.00
Reserves
44,202.41
37,750.64
32,639.91
22,395.34
18,
Net Worth
44,676.51
38,220.48
33,107.86
22,808.54
18,
Deposits
322,441.9 4
280,944.56
252,613.59
220,104.30
189,
Borrowings
79,758.27
50,290.94
43,951.10
34,071.67
26,
Total Debt
402,200.2 1
331,235.50
296,564.69
254,175.97
215,
Other Liabilities & Provisions
15,055.67
13,788.89
10,888.11
8,643.28
8,
Total Liabilities
461,932.3 9
383,244.87
340,560.66
285,627.79
242,
Mar '15
Mar '14
Mar '13
Mar '12
M
12 mths
12 mths
12 mths
12 mths
1
Cash & Balances with RBI
19,818.84
17,041.32
14,792.09
10,702.92
13,
Balance with Banks, Money at Call
16,280.19
11,197.38
5,642.87
3,230.99
7,
230,066.76
196,965.96
169,759.54
142,
113,548.43
113,737.54
93,192.09
71,
Assets
Advances Investments
281,083.0 3 132,342.8
3 Gross Block Revaluation Reserves Accumulated Depreciation
2,413.05
2,310.54
2,230.54
2,188.56
0.00
0.00
0.00
0.00
2,
0.00
0.00
0.00
0.00
2,413.05
2,310.54
2,230.54
2,188.56
101.26
99.67
125.11
70.77
Other Assets
9,893.19
8,980.79
7,066.56
6,482.93
4,
Total Assets
461,932.3 9
383,244.89
340,560.67
285,627.80
242,
Contingent Liabilities
640,183.5 9
608,547.25
574,782.38
514,871.98
477,
0.00
0.00
0.00
0.00
188.47
813.47
707.50
551.99
Net Block Capital Work In Progress
Bills for collection Book Value (Rs)
Profit & Loss of Axis Bank
2,
------------------- in Rs. Cr. ------------------Mar '15
Mar '14
Mar '13
Mar '12
M
12 mths
12 mths
12 mths
12 mths
Interest Earned
35,478.6 0
30,641.16
27,182.57
21,994.65
15,1
Other Income
8,365.05
7,405.22
6,551.11
5,420.22
4,6
Total Income
43,843.6 5
38,046.38
33,733.68
27,414.87
19,7
Interest expended
21,254.4 6
18,689.52
17,516.31
13,976.90
8,5
Employee Cost
3,114.97
2,601.35
2,376.98
2,080.17
1,6
11,710.72
10,173.91
8,309.22
6,773.35
5,9
405.67
363.93
351.73
342.24
2
0.00
0.00
0.00
0.00
Operating Expenses
9,203.74
7,900.77
6,914.23
6,007.10
4,7
Provisions & Contingencies
6,027.62
5,238.42
4,123.70
3,188.66
3,0
Total Expenses
36,485.8 2
31,828.71
28,554.24
23,172.66
16,3
Mar '15
Mar '14
Mar '13
Mar '12
M
12 mths
12 mths
12 mths
12 mths
1
7,357.82
6,217.67
5,179.43
4,242.21
3,3
0.00
0.00
0.00
0.00
10,029.26
7,329.45
4,969.77
3,4
16,246.93
12,508.88
9,211.98
6,8
0.00
0.00
0.00
1
Income
Expenditure
Selling, & Misc Expenses Depreciation Preoperative Exp Capitalised
Net Profit for the Year Extraordinary Items Profit brought forward Total Preference Dividend
13,501.4 5 20,859.2 7 0.00
Equity Dividend
1,087.54
939.69
843.86
658.24
221.42
161.44
143.37
111.83
31.04
132.33
110.68
102.67
Equity Dividend (%)
230.00
200.00
180.00
160.00
1
Book Value (Rs)
188.47
813.47
707.50
551.99
4
1,926.82
1,644.36
1,492.38
1,112.46
8
0.00
-0.01
0.01
0.00
3
1,308.96
1,101.13
987.23
770.07
6
13,501.45
10,029.26
7,329.45
4,9
16,246.93
12,508.88
9,211.98
6,8
Corporate Dividend Tax
5
Per share data (annualised) Earning Per Share (Rs)
Appropriations Transfer to Statutory Reserves Transfer to Other Reserves Proposed Dividend/Transfer to Govt Balance c/f to Balance Sheet Total
17,623.4 9 20,859.2 7
Source : Dion G
Profit & Loss of Axis Bank
------------------- in Rs. Cr. ------------------Mar '15
Mar '14
Mar '13
Mar '12
M
12 mths
12 mths
12 mths
12 mths
1
Interest Earned
35,478.6 0
30,641.16
27,182.57
21,994.65
15,
Other Income
8,365.05
7,405.22
6,551.11
5,420.22
4,
Total Income
43,843.6 5
38,046.38
33,733.68
27,414.87
19,
21,254.4 6
18,689.52
17,516.31
13,976.90
8,
Income
Expenditure Interest expended Employee Cost
3,114.97
2,601.35
2,376.98
2,080.17
1,
11,710.72
10,173.91
8,309.22
6,773.35
5,
405.67
363.93
351.73
342.24
0.00
0.00
0.00
0.00
Operating Expenses
9,203.74
7,900.77
6,914.23
6,007.10
4,
Provisions & Contingencies
6,027.62
5,238.42
4,123.70
3,188.66
3,
Total Expenses
36,485.8 2
31,828.71
28,554.24
23,172.66
16,
Mar '15
Mar '14
Mar '13
Mar '12
Selling, & Misc Expenses Depreciation Preoperative Exp Capitalised
M
Net Profit for the Year Extraordinary Items Profit brought forward Total Preference Dividend
12 mths
12 mths
12 mths
12 mths
1
7,357.82
6,217.67
5,179.43
4,242.21
3,
0.00
0.00
0.00
0.00
10,029.26
7,329.45
4,969.77
3,
16,246.93
12,508.88
9,211.98
6,
13,501.4 5 20,859.2 7 0.00
0.00
0.00
0.00
1,087.54
939.69
843.86
658.24
221.42
161.44
143.37
111.83
31.04
132.33
110.68
102.67
Equity Dividend (%)
230.00
200.00
180.00
160.00
Book Value (Rs)
188.47
813.47
707.50
551.99
1,926.82
1,644.36
1,492.38
1,112.46
0.00
-0.01
0.01
0.00
1,308.96
1,101.13
987.23
770.07
13,501.45
10,029.26
7,329.45
4,
16,246.93
12,508.88
9,211.98
6,
Equity Dividend Corporate Dividend Tax Per share data (annualised) Earning Per Share (Rs)
Appropriations Transfer to Statutory Reserves Transfer to Other Reserves Proposed Dividend/Transfer to Govt Balance c/f to Balance Sheet Total
17,623.4 9 20,859.2 7
Source : Dion G
Balance Sheet of ICICI Bank
------------------- in Rs. Cr. ------------------Mar '15
Mar '14
Mar '13
Mar '12
M
12 mths
12 mths
12 mths
12 mths
1
Total Share Capital
1,159.66
1,155.04
1,153.64
1,152.77
1,
Equity Share Capital
1,
Capital and Liabilities: 1,159.66
1,155.04
1,153.64
1,152.77
Share Application Money
7.44
6.57
4.48
2.39
Preference Share Capital
0.00
0.00
0.00
0.00
Reserves
79,262.26
72,051.71
65,547.84
59,250.09
53,
Net Worth
80,429.36
73,213.32
66,705.96
60,405.25
55,
331,913.66
292,613.63
255,499.96
225,
154,759.05
145,341.49
140,164.91
109,
486,672.71
437,955.12
395,664.87
335,
Deposits Borrowings Total Debt
361,562.7 3 172,417.3 5 533,980.0 8
Other Liabilities & Provisions
31,719.86
34,755.55
32,133.60
17,576.98
15,
Total Liabilities
646,129.3 0
594,641.58
536,794.68
473,647.10
406,
Mar '15
Mar '14
Mar '13
Mar '12
M
12 mths
12 mths
12 mths
12 mths
1
Cash & Balances with RBI
25,652.91
21,821.83
19,052.73
20,461.29
20,
Balance with Banks, Money at Call
16,651.71
19,707.77
22,364.79
15,768.02
13,
338,702.65
290,249.44
253,727.66
216,
177,021.82
171,393.60
159,560.04
134,
4,725.52
4,678.14
4,647.06
4,614.69
4,
0.00
0.00
0.00
0.00
Assets
Advances Investments Gross Block Revaluation Reserves Accumulated Depreciation
387,522.0 7 186,580.0 3
0.00
0.00
0.00
0.00
4,725.52
4,678.14
4,647.06
4,614.69
0.00
0.00
0.00
0.00
Other Assets
24,997.05
32,709.39
29,087.07
19,515.39
16,
Total Assets
646,129.2 9
594,641.60
536,794.69
473,647.09
406,
Contingent Liabilities
868,190.5 8
794,965.35
802,383.84
923,037.16
931,
0.00
0.00
0.00
0.00
138.72
633.92
578.21
524.01
Net Block Capital Work In Progress
Bills for collection Book Value (Rs)
4,
Source : Dion Global Solutions Limited
Profit & Loss of ICICI Bank
------------------- in Rs. Cr. ------------------Mar '15
Mar '14
Mar '13
Mar '12
M
12 mths
12 mths
12 mths
12 mths
44,178.15
40,075.60
33,542.65
25,9
10,427.87
8,345.70
7,502.76
6,6
54,606.02
48,421.30
41,045.41
32,6
1
Income Interest Earned Other Income Total Income
49,091.1 4 12,176.1 3 61,267.2 7
Expenditure Interest expended
30,051.5 3
27,702.59
26,209.18
22,808.50
16,9
Employee Cost
4,749.88
4,220.11
3,893.29
3,515.28
2,8
Selling, & Misc Expenses
14,631.5 6
12,296.88
9,503.20
7,731.85
7,1
Depreciation Preoperative Exp Capitalised
658.95
575.97
490.16
524.53
5
0.00
0.00
0.00
0.00
11,495.83
10,308.86
9,012.89
7,850.44
6,6
Provisions & Contingencies
8,544.56
6,784.10
4,873.76
3,921.22
3,8
Total Expenses
50,091.9 2
44,795.55
40,095.83
34,580.16
27,4
Mar '15
Mar '14
Mar '13
Mar '12
M
12 mths
12 mths
12 mths
12 mths
1
11,175.35
9,810.48
8,325.47
6,465.26
5,1
0.00
0.00
0.00
0.00
9,902.29
7,054.23
5,018.18
3,4
19,712.77
15,379.70
11,483.44
8,6
Operating Expenses
Net Profit for the Year Extraordinary Items Profit brought forward Total Preference Dividend
13,318.5 9 24,493.9 4 0.00
0.00
0.00
0.00
2,898.81
2,656.28
2,307.23
1,902.04
1,6
271.15
231.25
292.16
220.35
2
19.28
84.95
72.17
56.09
Equity Dividend (%)
250.00
230.00
200.00
165.00
1
Book Value (Rs)
138.72
633.92
578.21
524.01
4
4,062.57
3,506.65
2,878.03
2,306.49
1,7
0.00
0.00
0.00
0.33
3,169.96
2,887.53
2,599.39
2,122.39
1,8
13,318.59
9,902.29
7,054.23
5,0
19,712.77
15,379.71
11,483.44
8,6
Mar '15
Mar '14
Mar '13
Mar '12
M
Face Value
2.00
10.00
10.00
10.00
Dividend Per Share
4.60
20.00
18.00
16.00
Operating Profit Per Share (Rs)
22.89
93.96
66.33
56.94
Net Operating Profit Per Share (Rs)
149.6 7
652.16
580.88
532.30
--
--
--
--
Equity Dividend Corporate Dividend Tax Per share data (annualised) Earning Per Share (Rs)
Appropriations Transfer to Statutory Reserves Transfer to Other Reserves Proposed Dividend/Transfer to Govt Balance c/f to Balance Sheet Total
17,261.4 2 24,493.9 5
Source : Dion Global Solutions Limited
Key Financial Ratios of Axis Bank
Investment Valuation Ratios
Free Reserves Per Share (Rs)
Bonus in Equity Capital
--
--
--
--
7.34
7.67
7.90
7.46
Adjusted Cash Margin(%)
17.70
17.29
16.39
16.72
Net Profit Margin
20.73
20.29
19.05
19.28
Return on Long Term Fund(%)
72.32
73.36
75.72
88.84
Return on Net Worth(%)
16.46
16.26
15.64
18.59
Adjusted Return on Net Worth(%)
16.46
16.26
15.64
18.59
813.47
707.50
551.99
813.47
707.50
551.99
Profitability Ratios Interest Spread
Return on Assets Excluding Revaluations Return on Assets Including Revaluations
188.4 7 188.4 7
Management Efficiency Ratios Interest Income / Total Funds
8.40
8.47
8.68
8.33
Net Interest Income / Total Funds
3.37
3.30
3.09
3.04
Non Interest Income / Total Funds
1.98
2.05
2.09
2.05
Interest Expended / Total Funds
5.03
5.16
5.59
5.29
Operating Expense / Total Funds
2.08
2.08
2.10
2.14
Profit Before Provisions / Total Funds
3.17
3.17
2.97
2.81
Net Profit / Total Funds
1.74
1.72
1.65
1.61
Loans Turnover
0.14
0.14
0.15
0.14
Total Income / Capital Employed(%)
10.38
10.51
10.77
10.38
Interest Expended / Capital Employed(%)
5.03
5.16
5.59
5.29
Total Assets Turnover Ratios
0.08
0.08
0.09
0.08
Asset Turnover Ratio
0.09
0.09
0.09
0.09
Interest Expended / Interest Earned
59.91
60.99
64.44
63.55
Other Income / Total Income
19.08
19.46
19.42
19.77
Operating Expense / Total Income
20.07
19.81
19.45
20.66
--
--
--
--
Capital Adequacy Ratio
15.09
16.07
17.00
13.66
Advances / Loans Funds(%)
76.65
73.29
71.53
72.29
Credit Deposit Ratio
84.71
80.03
77.58
76.26
Investment Deposit Ratio
40.75
42.60
43.77
40.35
Cash Deposit Ratio
6.11
5.97
5.39
6.01
Total Debt to Owners Fund
7.22
7.35
7.63
9.65
Financial Charges Coverage Ratio
0.65
0.63
0.55
0.56
Financial Charges Coverage Ratio Post Tax
1.37
1.35
1.32
1.33
0.03
0.03
0.03
0.03
20.64
18.57
20.10
21.63
Dividend Payout Ratio Net Profit
14.78
15.11
16.29
15.51
Dividend Payout Ratio Cash Profit
14.00
14.27
15.25
14.35
Earning Retention Ratio
85.22
84.89
83.71
84.49
Cash Earning Retention Ratio
86.00
85.73
84.75
85.65
Profit And Loss Ratios
Selling Distribution Cost Composition Balance Sheet Ratios
Debt Coverage Ratios
Leverage Ratios Current Ratio Quick Ratio Cash Flow Indicator Ratios
AdjustedCash Flow Times
41.53
42.69
45.67
48.01
Mar '15
Mar '14
Mar '13
Mar '12
Earnings Per Share
31.04
132.33
110.68
102.67
Book Value
188.4 7
813.47
707.50
551.99
Source : Dion Global Solutions Limited
M
Related Documents 3m3m1z
Key Financial Ratios Of Icici Bank l2f71
November 2019 52
Financial Performance Of Icici Bank 4o3673
December 2019 120
Financial Statement Analysis Of Icici Bank 5d1y18
October 2019 48
Swot Of Icici Bank 276d5r
December 2019 82
Introduction Of Icici Bank 5j5n12
October 2019 52
Ppt Of Icici Bank i731
December 2019 38More Documents from "Raman Suthar" 171870
Key Financial Ratios Of Icici Bank l2f71
November 2019 52
July 2021 0

November 2019 38

Training Information 276a2e
August 2021 0
Duke Plasto Technique Pvt 2r5y6d
July 2022 0
December 2019 38