Compaction Report 2ch26
This document was ed by and they confirmed that they have the permission to share it. If you are author or own the copyright of this book, please report to us by using this report form. Report 3b7i
Overview 3e4r5l
& View Compaction Report as PDF for free.
More details w3441
- Words: 920
- Pages: 6
CVE20005
Compaction Report Road Engineering
Report No : 1 Group No : 4 Name : Harinder Rehal Student Id: 5827019
CVE20005
Due Date : 23/10/2015 Introduction The proctor compaction test is a laboratory method of experimentally determining the optimal moisture content at which given soil with weight of 2.5 k will become most dense and achieve its maximum dry density . the dry density of a soil for given compactive effort depends on amount of water the soil contains during soil compaction .
Aim To determine the relation between the Moisture Content and Dry Density of a soil when compacted using the Australian Standard (AS1289.5.1.1) test method.
Procedure 1. Five samples of soil have been supplied, each of 2.5 kg. These were obtained by ing sieved soil through a sample splitter. 2. Thoroughly mix each portion with a suitable amount of water, to give moisture contents as directed. 3. The wetted portions should be cured for an adequate time to allow water to become more uniformly distributed throughout the soil before compaction. Heavy clays may take up to a week, sands an hour or so. This time has to be overlooked to complete your practical work, but you should realize that this can lead to significant errors. 4. Record the mass of the Mould and base plate only to the nearest 1.0g. 5. Assemble the Mould, collar and base plate and place on a rigid foundation. 6. Take a portion of the wetted soil, mix thoroughly, and compact it into the Mould in three layers, not varying the compacted layers by more than 6mm. Use 25 uniformly distributed blows/layer using the standard hammer. Slightly overfill the Mould, leaving not more than 6mm to be struck off after removing the collar. 7. Carefully remove the collar. 8. Level the compacted soil to the top of the Mould with a straight edge and patch any holes with fine material.
CVE20005 9. Record the mass of the Mould, base plate and soil to the nearest 1.0g. 10. Remove the soil specimen from the Mould and obtain a representative sample from the full height of the specimen. Determine the moisture content (w) of the sample in accordance with AS 1289.2.1.1 (Oven drying method) 11.
Repeat the above for the remaining samples.
12.
Plot p dry vs moisture content on the graph provided.
Table 1 (Bulk & Dry Determinations ) Test No:
1
2
3
4
5
Mass of Mould + Wet Soil (g)
7320.3
7282.3
7600.7
7380.7
7336.3
Mass of Mould (g)
5078.2
5006.7
5271.5
5075.5
5054.3
Mass of wet Soil (g)
2242.1
2275.6
2329.2
2304.8
2282
Wet Density (t/m3)
2.25
2.28
2.34
2.31
2.29
Dry Density (t/m3)
2.13
2.15
2.24
2.15
2.25
Table 2 (Moisture content Determinations ) Test No: Tin No: Mass of tin + Wet Soil (g) Mass of tin + Dry Soil (g) Mass of tin (g) Mass of Moisture (g) Mass of Dry soil (g) MOISTURE CONTENT (%)
1 Mb1
2 M16
3 M28
4 M12
5 M29
2516.2
2549.5
2617.7
2544.8
2519.9
2399.8
2413.1
2521.4
2383.3
2486.6
277.5 150 2500
281.6 175 2500
358.78 200 2500
266.8 225 2500
339.7 250 2500
5.5
6.38
4.42
7.63
1.55
Table 3 Void Ratio voild Ratio
Test No : Test No : Test No : Test No : Test No : 1 2 3 4 5 5.4564734 5.4222260 5.820979 5.3334255 6.142252 0 06 89 704 43 712
CVE20005 0.05 0.1
5.1836497 36 4.9108260 66
5.1511147 85 4.8800034 8
5.529930 5.0667542 719 66 5.238881 4.8000829 734 88
5.835140 076 5.528027 441
Calculation
Total volume = 0.000997m3 Gs = 2.8
Mass of wet soil−Mass of dry soil X 100 Massof dry soil
Moisture content =
2516.2−2399.8 X 100 2399.8−277.5
Wet density =
Dry density =
=
= 5.5%
Mass of Wet soil total volume
=
Wet density 1+ Moisture content
2516.2 0.000997
=
= = 2.25 t/m3
2.24 1+0.054
= 2.13 t/m3
For the 3 different air voids content:
(
Gs 1− Dry density =
A X Wet Density 100 wGs (1+ ) 100
)
0 X 2.24 100 5.5 X 2.8 (1+ ) 100
(
2.8 1− =
)
= 5.45
Discussion Compaction is essential to increase the shear strength , decrease the compressibility , decrease its permeability and minimize long term settlement in the soil . . By finding the optimum moisture content and maximum dry density it allows to find gauge the soils strength. When soils close to 0% moisture content it can only be compacted by so much but as water is added, the dry unit weight increases because the water lubricates the particles making compaction easier. Group 5 had less compaction % therefore dry density was higher than any other group . As more water is added and the water content becomes larger than the optimum values, the void spaces become filled with water so further compaction is not possible. From graph of moisture content Vs dry density we can analysed
CVE20005 that our graph is not in proper curve shape reason is our moisture content is not in increasing order . Higher percentage of water content leads to lowest moisture content , dry density and wet density . If a road embankment specification required a relative density of 95% of maximum Pdry which would be 2.13 of 2.25 of maximum dry density and moisture content will be 7.63 % .
Conclusion As a conclusion we managed to determine optimum moisture content of 7.63 % with the calculated maximum dry density of 2.25 Mg/m^3 .
CVE20005
Related Documents 3m3m1z
Compaction Report 2ch26
April 2020 21
Compaction Test Report 1n1fs
October 2019 68
Kneading Compaction 455sh
October 2021 0
Explosive Compaction 71q6k
November 2020 0
Standard Proctor Compaction Test 1n6t6r
January 2022 0
Dynamic Compaction 103e39
November 2020 0More Documents from "harinder" 38252m
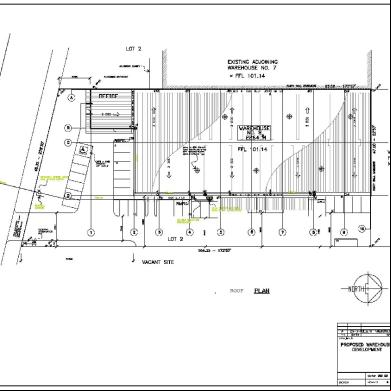
Warehouse Architectural Drawings 38675n
October 2021 0
Compaction Report 2ch26
April 2020 21
Employee Self Service - Bsnl Erp Manual 2o6170
November 2019 97
Sankat.mochan.shabad.by.giani.gurcharan.singh.(gurmatveechar.com).pdf 6t4l5u
November 2019 70