Copy Of Learning Competency Directory 1s1y
This document was ed by and they confirmed that they have the permission to share it. If you are author or own the copyright of this book, please report to us by using this report form. Report 3b7i
Overview 3e4r5l
& View Copy Of Learning Competency Directory as PDF for free.
More details w3441
- Words: 1,714
- Pages: 3
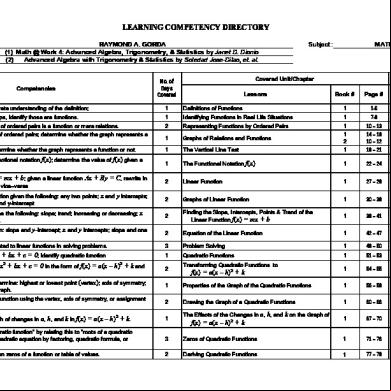
LEARNING COMPETENCY DIRECTORY Teacher's Name: Reference Used:
RAYMOND A. GORDA (1) Math @ Work 4: Advanced Algebra, Trigonometry, & Statistics by Janet D. Dionio (2) Advanced Algebra with Trigonometry & Statistics by Soledad Jose-Dilao, et. al.
MATHEMATICS IV
Covered Unit/Chapter
No. of Days Covered
Competencies
Subject::
Lessons
Target Activities Book #
Page #
Letter/ No.
Book #
Page #
Define a function and demonstrate understanding of the definition;
1
Definitions of Functions
1
1-6
A–D
1
2–6
Given some real life relationships, identify those are functions.
1
Identifying Functions in Real Life Situations
1
7-9
A–C
1
8–9
Determine whether a given set of ordered pairs is a function or mere relations.
2
Representing Functions by Ordered Pairs
1
10 – 13
A–C
1
11 – 13
14 – 18 10 – 12
A–B
1
14 – 16
Draw the graph of a given set of ordered pairs; determine whether the graph represents a function or a mere relation.
1
Graphs of Relations and Functions
1 2
Use the vertical line test to determine whether the graph represents a function or not.
1
The Vertical Line Test
1
19 – 21
A–B
1
20 – 21
Illustrate the meaning of the functional notation f(x); determine the value of f(x) given a value for x.
1
The Functional Notation f(x)
1
22 – 24
A–B
1
23
Define the linear function f(x) = mx + b; given a linear function Ax the form of f(x) = mx + b and vice–versa
2
Linear Function
1
27 – 29
A–C
1
28 – 29
Draw the graph of a linear function given the following: any two points; x and y intercepts; slope and one point; or slope and y-intercept
2
Graphs of Linear Function
1
30 – 38
A–E
1
31 – 38
Given f(x) = mx + b, determine the following: slope; trend; increasing or decreasing; x and y intercept; or some points.
2
Finding the Slope, Intercepts, Points & Trend of the Linear Function f(x) = mx + b
1
39 – 41
A–C
1
40 – 41
Determine f(x) = mx + point; or any two points
2
Equation of the Linear Function
1
42 – 47
A–F
1
43 – 47
3
Problem Solving
1
48 – 50
1
49 – 50
1
Quadratic Functions
1
51 – 53
A–C
1
52 – 53
1
54 – 55
A, B
1
55
A, B
1
57 – 59
1
62 – 66
+ By = C, rewrite in
b given: slope and y-intercept; x and y intercepts; slope and one
Apply knowledge and skills related to linear functions in solving problems. Define a quadratic function ax
2
+ bx + c = 0; identify quadratic function Rewrites a quadratic function ax2 + bx + c = 0 in the form of f(x) = a(x – h)2 + k and vice–versa
2
Transforming Quadratic Functions to
f(x) = a(x – h)2 + k
Given a quadratic function, determine: highest or lowest point (vertex); axis of symmetry; or direction of opening of the graph.
1
Properties of the Graph of the Quadratic Functions
1
56 – 59
Draw the graph of a quadratic function using the vertex, axis of symmetry, or assignment of points.
2
Drawing the Graph of a Quadratic Functions
1
60 – 66
1
67 – 70
A–C
1
68 – 70
The Effects of the Changes in a, h, and k on the Graph of
= a(x – h)2 + k.
1
Determine the “zeros of a quadratic function” by relating this to “roots of a quadratic equation”; find the roots of a quadratic equation by factoring, quadratic formula, or completing the square.
3
Zeros of Quadratic Functions
1
71 – 76
A–D
1
73 – 76
Derive a quadratic function given zeros of a function or table of values.
2
Deriving Quadratic Functions
1
77 – 79
A–C
1
78 – 79
Analyze the effects on the graph of changes in a, h, and k in f(x)
f(x) = a(x – h)2 + k
Apply knowledge and skills related to quadratic functions and equations in problem solving.
3
Application of Quadratic Functions
1
80 – 83
Review the definition of polynomials; identify a polynomial from a list of algebraic expressions.
1
Polynomials
1
91 – 94
Define a polynomial function; identify a polynomial function from a given set of relations; determine the degree and number of of a given polynomial function
3
Polynomial Functions
1
Find the quotient of polynomials by algorithm & synthetic division; find by synthetic division the quotient and the remainder when p(x) is divided by (x – c)
3
Division of Polynomials
State and illustrate the Remainder Theorem; find the value of p(x) for x division or remainder theorem; state and illustrate the factor theorem
4
Find the zeros of polynomial functions of degree greater than 2 by factor theorem, factoring, synthetic division, or depressed equations.
1
81 – 83
A–D
1
92 – 94
95 – 100
A–F
1
97 – 100
1
101 – 105
A–D
1
103 – 105
The Remainder Theorem & the Factor Theorem
1
106 – 109
A–D
1
108 – 109
3
Zeros of Polynomial Functions of Degree Greater than 2
1
113 – 117
A–D
1
116 –117
Identify certain relationships in real life which are exponential; define the exponential function f(x) = ax and differentiate it from other functions; given a table of ordered pairs, state whether the trend is exponential or not
2
Definition of Exponential Functions
1
122 – 126
A–C
1
123 – 126
Draw the graph of an exponential function f(x) = ax ; describe some properties of the exponential function or its graph; given the graph of an exponential function determine the domain, range, intercepts, trend, & asymptote
2
Properties of Exponential Function & Its Graph
1
135 – 138
A–E
1
136 – 138
Use the laws on exponents to find the zeros of exponential functions
2
Laws of Exponents
1
139 – 141
A–D
1
140 – 141
Define inverse functions; determine the inverse of a given function
2
Inverse Functions/Relations
1
142 –146
A–D
1
144 –146
Define the logarithmic function f(x) f(x) = ax.
1
The Logarithmic Function
1
147 – 148
A–B
1
148
State the laws for logarithms; apply the laws for logarithms; solve simple logarithmic equations.
4
Laws of Logarithms Application of the Laws of Logarithms
1
150 – 153
A–C
1
152 – 153
Solve problems involving exponential and logarithmic functions.
3
Application of Exponential and Logarithmic Functions
1
154 – 156
A
1
155 – 156
Define unit circle, arc lengths, & unit measures of an angle; convert from degree to radian and vice–versa.
3
The Unit Circle
1
157 – 159
A–C
1
158 – 159
Illustrates angles in standard position, coterminal angles, & reference angle.
3
Angles in Standard Position
1
160 – 162
A–C
1
161 – 162
Visualize rotations along the unit circle and relate these to angle measures (clockwise or counterclockwise directions): length of an arc, angles beyond 360o or 2π radians
2
Rotations Along the Unit Circle
1
163 – 165
A–B
1
163 – 165
Given an angle in standard position in a unit circle, determine the coordinates of the point of intersection of the unit circle and the terminal side.
3
Coordinates of the Point of Intersection of the Unit Circle and the Terminal Side
1
170 – 171
A–E
1
170 – 171
Define sine functions; state the sine of an angle; define cosine functions; state the cosine of an angle
3
The Sine Function & the Cosine Function of Special Number
1
172 – 175
A–C
1
173 – 175
Define tangent function and other circular functions; state the tangent and other circular functions of an angle
4
The Tangent Function and Other Circular Functions of θ. Use of Calculator to Get sin θ, cos θ, & tan θ.
1
176 – 181
A–D
1
177 – 181
Describe the properties of the graphs of sine, cosine, & tangent functions.
2
Graphs of Sine, Cosine, & Tangent Functions
1
182 – 183
A–D
1
183
State the fundamental trigonometric identities and use these identities to solve other identities.
2
The Eight Fundamental Identities
1
184 – 186
A–E
1
185 – 186
Solve simple trigonometric equations.
2
Simple Trigonometric Equations
2
240 – 243
5–9
2
243
Solve problems involving right triangles.
3
Solving Right Triangle Applications of the Trigonometric Functions
2
246 – 247 248 – 250
1–5 1–5
2
247 249 – 250
= k by synthetic
= loga x as the inverse of the exponential function
Solve problems involving triangles using the sine law.
2
The Law of Sine
2
250 – 253
2
257 – 258
Solve problems involving triangles using the cosine law.
2
The Law of Cosine
2
254 – 258
2
257 – 258
Define statistics, sample, & population; give the importance of the study of statistics
2
Statistics Defined
2
264 – 267
2
266 – 267
State and explain the different sampling techniques
2
Sampling
2
267 – 272
2
272
Analyze, Interpret accurately, and draw conclusion from graphic and tabular presentation of statistical data
4
Organizing Data Table & Graphs
2
273 – 280
2
275, 278, 279, 281
Construct frequency distribution table
2
Frequency Distribution
2
282 – 285
2
284 – 285
Use the rules of summation to find sums
2
Summation
2
286 – 289
2
289
Find the arithmetic mean, grouped & ungrouped
3
The Mean
2
290 – 294
2
294
Find the median, grouped & ungrouped
4
The Median
2
295 – 298
2
298
Find the mode, grouped & ungrouped
2
The Mode
2
299 – 301
2
300 – 301
calculate the different measures of variability relative to a given set of data, grouped or ungrouped, range & standard deviation; give the characteristics of a set of data using the measures of variability
5
Measures of Variability
2
302 – 307
2
303, 305, 307
from a given statistical data, analyze, interpret, draw conclusions, make predictions, and make recommendations / decisions.
4
Analyzing Data Set
2
308 – 311
2
310 – 311
Related Documents 3m3m1z
Copy Of Learning Competency Directory 1s1y
December 2019 102
Competency Directory Overview Cg 4z5s28
December 2019 32
Competency Based Learning Material 594q4g
December 2021 0
4_final Competency Based Learning Materials 2s4w4o
January 2021 0
Copy Of Memletics Learning Styles Inventory 2nf14
December 2022 0
Concept Of Entrepreneurial Competency 4z3z1p
November 2019 35More Documents from "Raymond Gorda" 4m1d1d
K-12 Grade 8 Learner's Module 2.pdf 2n2y6b
December 2019 84
Dance Steps Of Kuratsa 11j1f
October 2019 164
Copy Of Learning Competency Directory 1s1y
December 2019 102
Spanish Gri 403 Occupational Health And Safety 2016 6kz5m
May 2021 0
Our Country, Our Parliament.pdf 4n1uq
November 2022 0